The California-based startup HeyGen has launched an impressive AI tool that can translate videos into eight different languages and even synchronize the lip movements of the speakers. This AI-powered dubbing tool, which was recently released in beta, allows users to upload videos and translate the spoken content they contain into one of eight languages while adjusting the lip movements of the speakers accordingly. One notable feature is that this translation can be done in less than six minutes, making the technology both fast and efficient.
The bridge to tourism is easy to make. This technology could usher in a revolution in the tourism sector by breaking down the language barriers that often exist between hosts and tourists. Imagine you are a tour operator or a hotel owner, and you want to target a wider range of customers from different countries. With the HeyGen tool, you could easily translate your promotional videos, instructions or welcome messages into different languages, creating a more personal connection with tourists from all over the world. The ability to retain the speaker’s authentic voice and synchronize lip movements provides a high level of realism and professionalism that is often lacking in traditional translation methods.
HeyGen Video Translation
In addition, tourist attractions and historical sites could use this technology to create multilingual tours and presentations. This would not only enrich the experience for foreign visitors, but also increase the reach and appeal of the destination. The technology could also be used in real time to allow tour guides or tourist information centers to communicate in different languages without relying on human translators.
The HeyGen tool opens up a world of possibilities for the tourism industry by facilitating communication and encouraging interaction between service providers and tourists from different cultural and linguistic backgrounds. As such AI technologies continue to improve and spread, the global tourism landscape is likely to become even more inclusive and accessible.
Those who would like to test the free version of Video Translation, then do so at: https://labs.heygen.com/video-translate. Currently, however, there is a longer waiting period and they will be notified by eMail when their video is ready for download.
Chat GPT is currently the talk of the town, and it turns out that GPT4, in particular, is very powerful. But the model also has its weaknesses. One of them is that it was trained on a huge amount of data, but it only lasts until September 2021. This means that current information is not taken into account in the model. There is a browser plug-in for the Pro users, but my tests with it have shown that the search is not very productive, especially when GPT has to research the data from numerous different sources in advance, which also takes a relatively long time. Secondly, this plugin is not included in the API.
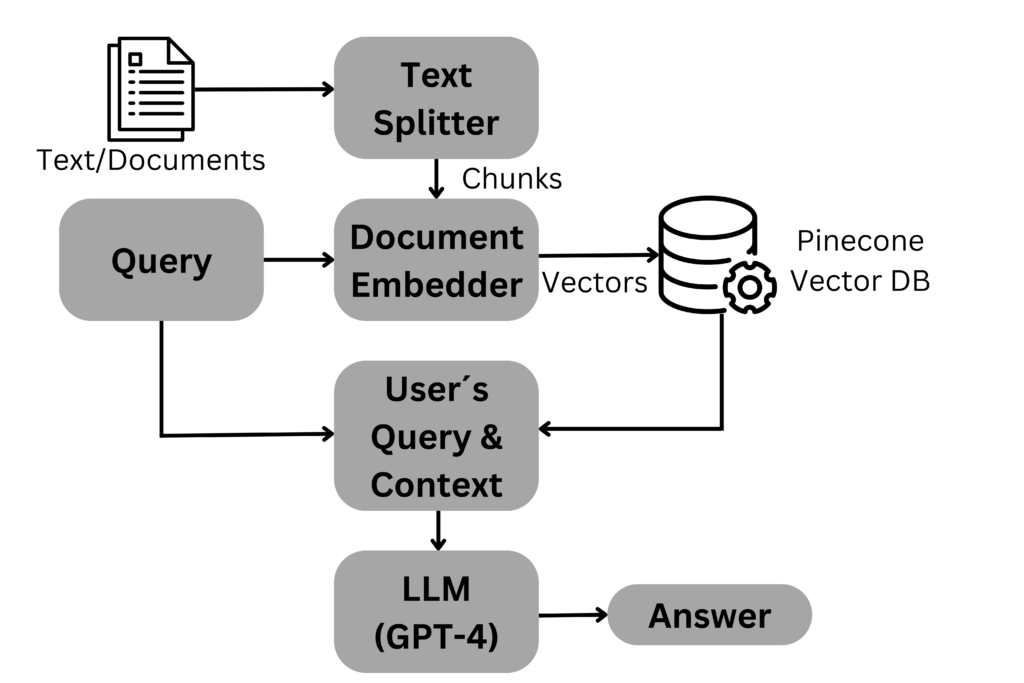
So if you want to build a web app such as a chatbot with GPT, you need other ways to get around these disadvantages. In the last few weeks, I have been working intensively on solutions for this, whereby the use of langchain in connection with the vector database Pinecone, in particular, seems to be gaining ground. Langchain is a framework for large language models (LLMs) that can be used for generative question answering, text summarisation etc. Components such as prompt templates, agents, memory or LLMs can be “chained”.
GPT only allows a certain number of tokens as input and also only generates a certain number of tokens as output (depending on the version). The approach presented below has the following idea. If one wants to use external data, this data must be converted into vectors (document embedding). This data is then stored in Pinecone, a vector database. If a user then asks a question in the app, this is also converted into vectors. This vector is then compared with the vectors in the database, and the most similar vectors (text elements) are used to generate the prompt. In this way, the problem of the limited number of tokens can be elegantly circumvented.
I have built a prototype based on this idea that can be tested. I have crawled some descriptions of Amsterdam from Lonely Planet (as a prototype, I did not pay attention to completeness). You can now ask the Tourism Bot questions about Amsterdam (in any language).
Emotions are an essential part of human behavior, and they play a vital role in our social interactions. Recognizing emotions can be challenging, especially when we are dealing with complex social situations or non-verbal communication. But with the advent of artificial intelligence, emotion detection from images has become a reality. In this blog post, I will explore what emotion detection from images is and what we can learn from it.
What is Emotion Detection from Images?
Emotion detection from images is a computer vision technique that uses machine learning algorithms to recognize and classify human emotions from images. The technology works by analyzing facial expressions and body language to determine the emotions being expressed. The system can identify a range of emotions, including happiness, sadness, anger, fear, surprise, and disgust.
The process involves several steps, starting with facial detection, where the system identifies the face in the image. Next, the system extracts facial features, such as the position of the eyes, mouth, and nose, and analyzes them to determine the emotional state. The algorithm then assigns a probability score to each emotion, indicating the likelihood of that emotion being expressed in the image.
I used py-feat, which is a great python library for analyzing facial expressions (https://py-feat.org/).
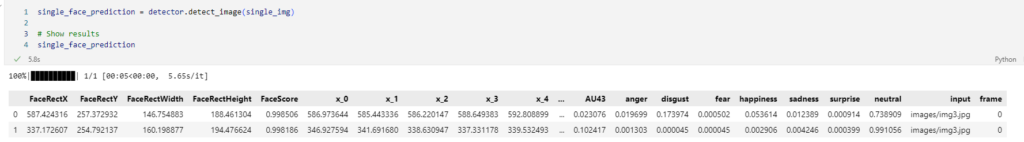
So let´s take this photo. We can load the image with PIL and define a detector. In this case it was a face-model, a landmark-model, an AU-Model, an emotion-model and a facepose-model.
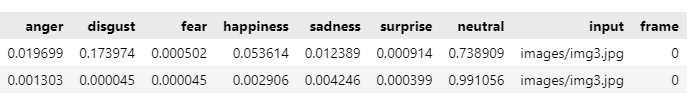
The face-model recognizes two faces, and the emotion-model detects the emotions and outputs a probability score.
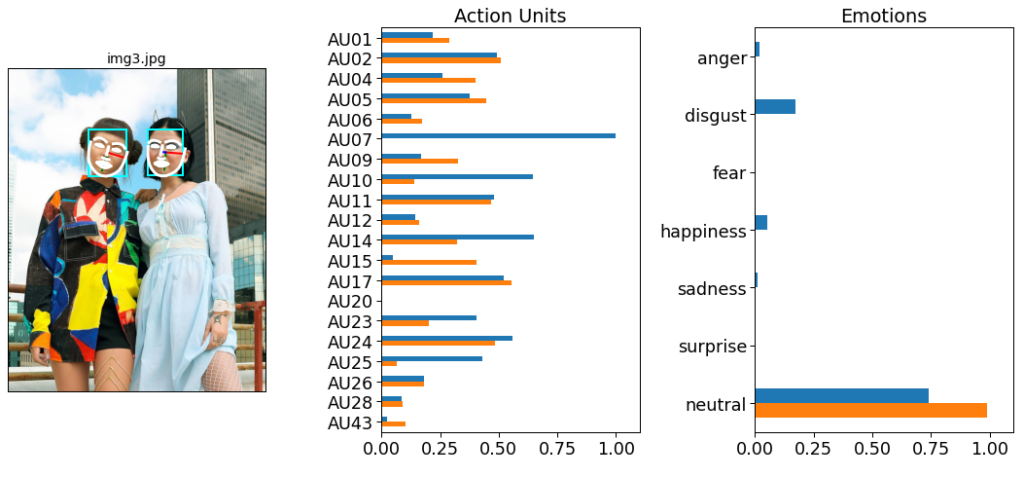
We also receive the Action Units (AUs), which represent facial muscles. For example, an emotion such as sadness is often characterized by patterns such of AU1+AU4+AU15. For details, check the py-feat documentation.
We can even visualize the detection results by overlaying facial lines on top of the input image and by visualizing the strength of AUs and, finally, the detected emotions.
Emotion detection can provide valuable insights for the tourism industry, enabling businesses to understand the emotional experiences of their customers better and make data-driven decisions to improve the overall travel experience. By leveraging this technology, tourism businesses can create more personalized, engaging, and satisfying experiences for their customers, leading to increased customer loyalty and positive word-of-mouth marketing.
ChatGTP is currently on everyone’s lips. Currently, there is no API for ChatGTP, but I tried to use the possibilities offered by OpenAI for a simple recommender system in tourism. Here is an example, which I implemented in Python and with Flask (it doesn’t win any beauty contests, but shows the idea behind it) using OpenAI´s GTP-3. GPT-3, the latest version of the Generative Pre-training Transformer (GPT) model, has the ability to generate human-like text, making it a powerful tool for creating a recommender system in the tourism industry.
A recommender system in tourism is a tool that helps visitors plan their trip by suggesting places to visit, things to do, and accommodations based on their preferences. GPT-3 can be used to create a more personalized and accurate recommendation system by analyzing the user’s input and providing relevant suggestions.
One way GPT-3 can be used for a recommender system in tourism is by creating a chatbot that can understand the user’s needs and preferences. For example, if a user says they are interested in history and culture, the chatbot can recommend historical sites and museums to visit. In this video, you can see a simple input field where a user enters his question and how GTP-3 outputs the result.
GPT-3 can also be used to generate personalized itineraries for visitors based on their preferences and the time they have available. The generated itineraries can include suggested activities, accommodations, and transportation options, making it easy for visitors to plan their trip.
In a second attempt, I downloaded a list of about 700 destinations in Austria. This dataset contains the name of the place and the geocoordinates. With a Python script, I iterated over the list and got the answers to the question: “Describe {ctiy} as a tourist destination for each place.”
Afterwards, the answers were text-preprocessed (lowercasing, stopword removal, etc.) and embedded with BERT. The text was thus converted into a high-dimensional vector that can be further computed.
Afterwards, the vectors were clustered using the Louvain community detection algorithm. Thus, texts with similar descriptions could be grouped together. Finally, I visualized all locations on a map, with each location colored according to the assigned cluster. One can clearly see the places in Tyrol, which can largely all be assigned to the red cluster, as well as places in the Salzburg Salzach Valley. These are all typical winter and ski destinations. The locations in the blue cluster, primarily around Vienna and in Lower Austria, behave in a thematically similar manner.
It is only a small demo, but it shows the potential that the use of GTP-3 will have for tourism in the future.
In conclusion, GPT-3 is a powerful tool that can be used to create a more personalized and accurate recommender system in the tourism industry. By understanding the user’s needs and preferences, GPT-3 can provide relevant suggestions and make it easier for visitors to plan their trip.
Have you ever heard of Gaia-X? No, it is an ambitious project supported by the European Union with the goal of creating an open, secure, and interoperable platform for cloud services and data infrastructure in Europe. It is supported by a consortium of companies and organizations from various industries across Europe and is part of the EU’s strategy to promote digitalization in Europe. The platform aims to enable users to access and connect services and data from different providers, creating new business opportunities and strengthening the competitiveness of the European economy.
So, what does this have to do with the tourism industry?
The tourism industry is a significant contributor to the European economy, employing millions of people. In recent years, however, the industry has undergone significant changes due to technological advancements and digitalization, making it increasingly important for businesses to adapt and use new technologies to stay competitive.
This is where Gaia-X comes in. By leveraging the capabilities of Gaia-X, businesses in the tourism industry can connect and use data from different providers to create personalized offers for tourists. For example, by linking data from airlines, hotels, and other service providers, businesses can offer customized travel routes and packages tailored to the needs and preferences of tourists.
In addition to this, businesses in the tourism industry can also benefit from the security and interoperability of Gaia-X. By using Gaia-X, they can ensure that their data is processed securely and can be easily connected to other services and providers, improving the efficiency and performance of their businesses.
Overall, Gaia-X offers a unique opportunity for businesses in the tourism industry to adapt and use new technologies to stay competitive and create new business opportunities. It is important for businesses in this industry to take advantage of the opportunities provided by Gaia-X and get involved in the project to reap the benefits
Have you heard about WHISPER, the OpenAI language model? If not, you’re in for a treat! I recently tried out WHISPER for myself and was blown away by its capabilities. WHISPER is a large language model developed by OpenAI. It was trained on a massive dataset and trained on 680,000 hours of multilingual and multitask supervised data. You can choose between the small, basic and large model.
I was particularly impressed with the speech recognition of the large model, which, however, takes looooong if you don´t run it on a GPU until you receive the output. As input, I used an expert interview I recently gave for a PhD student. I recognized everything correctly, even a mixture between German and Englisch at the beginning of the interview – amazing! So I think of setting up Whisper to be used for my students. Whenever they do qualitative studies, it can be used for transcription.
Overall, I highly recommend giving WHISPER a try if you have the opportunity. It´s super easy to use (but I struggled with ffmpeg, which you also need to install).
import whisper model = whisper.load_model(“base”)options = whisper.DecodingOptions(fp16=False) result = model.transcribe(“test.mp3”) print(result[“text”])
ChatGPT is a large language model trained by OpenAI that can generate human-like text. This technology has the potential to assist with writing scientific articles by providing suggestions for words and phrases, as well as by generating entire sentences or paragraphs based on a given prompt. However, there are also some potential disadvantages and challenges associated with using ChatGPT for writing scientific articles.
One of the main advantages of ChatGPT is that it can help writers overcome writer’s block by providing suggestions for words and phrases. This can be especially useful for writers who are struggling to find the right words to express their ideas. ChatGPT can also assist with the editing and proofreading process by generating alternative word choices and suggesting grammatically correct sentences.
Another potential advantage of ChatGPT is that it can help writers generate ideas for their articles. By providing a prompt or topic, writers can use ChatGPT to generate a list of potential ideas or subtopics to explore in their article. This can be a useful way to brainstorm and come up with new and interesting ideas for scientific articles.
However, there are also some potential disadvantages and challenges associated with using ChatGPT for writing scientific articles. One of the main disadvantages is that ChatGPT is not capable of understanding the context or meaning of the text it generates. This means that the suggestions and sentences generated by ChatGPT may not always be relevant or accurate, and may require additional editing and proofreading by the writer.
Another potential disadvantage is that ChatGPT is not capable of generating original content. This means that writers who rely heavily on ChatGPT may be at risk of inadvertently committing plagiarism. Plagiarism is a serious concern in the scientific community, and can have serious consequences for writers who are found to have copied the work of others without proper attribution.
Overall, ChatGPT has the potential to assist with the writing of scientific articles by providing suggestions for words and phrases, as well as by generating ideas and sentences based on a given prompt. However, there are also some potential disadvantages and challenges associated with using ChatGPT, including the risk of generating irrelevant or inaccurate content, and the potential for plagiarism. Writers who use ChatGPT should be aware of these potential drawbacks and take steps to ensure that their use of the technology does not compromise the quality or integrity of their work.
The following video shows ChatGPT in action, writing a short essay about topic modeling in tourism.
The whole article was AI generated by ChatGTP
It only remains to mention that the quotes are also “fictitious”. Because none of the given sources actually exists. So if our students should use ChatGTP in the future to write their papers, you will find out quickly with a Google-Scholar comparison.
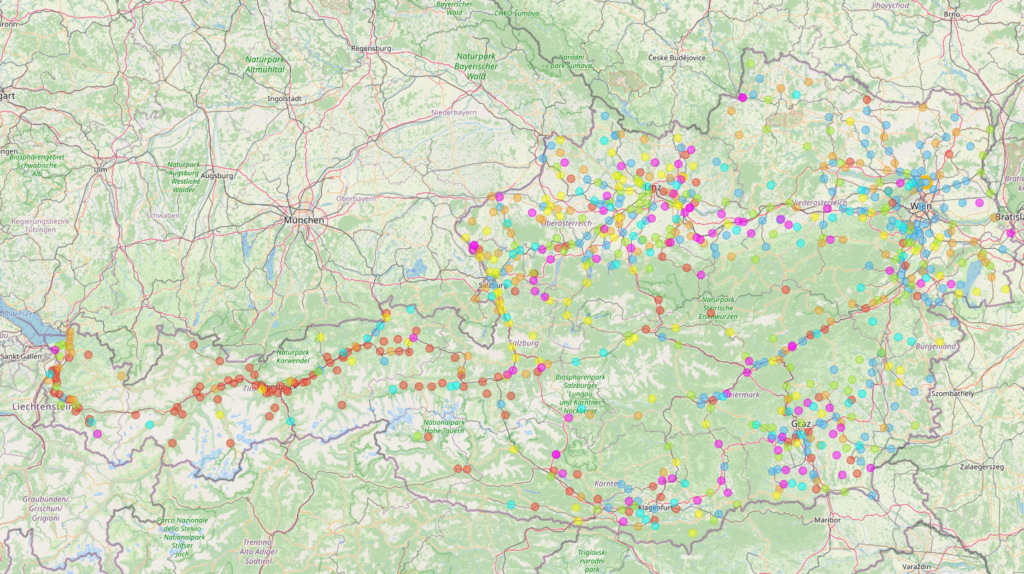
Have you been wondering what would be the best way to analyse short, text-heavy, and unstructured content from social media? Certainly, social media has opened an entirely new path for social science research, especially when it comes to the overlap between human relations and technology. In the 21st century, data-driven approaches provide brand-new perspectives on interpreting a phenomenon. Yet, methodological challenges emerge in both the data collection and analysis process. To shed light on the efficacy of different algorithms, his article takes tweets with #covidtravel as well as the combination of #covid and #travel as the reference points and evaluates the performance of four topic modeling; namely latent Dirichlet allocation (LDA), non-negative matrix factorization (NMF), Top2Vec, and BERTopic.
Introduction to the four models
LDA is a generative probabilistic model for discrete datasets. It is a three-level hierarchical Bayesian model, where each collection item is represented as a finite mixture over an underlying set of topics, and each topic is represented as an infinite mixture over a collection of topic probabilities. Since the number of topics need not be predefined, LDA provides researchers with an efficient resource to obtain an explicit representation of a document.
In contrast to LDA, NMF is a decompositional, non-probabilistic algorithm using matrix factorization and belongs to the group of linear-algebraic algorithms. NMF works on TF-IDF-transformed data by breaking down a matrix into two lower-ranking matrices. Specifically, NMF decomposes its input, which is a term-document matrix (A), into a product of a terms-topics matrix (W) and a topics-documents matrix (H). W contains the basis vectors, and H contains the corresponding weights.
Top2Vec is a comparatively new algorithm that uses word embeddings. That is, the vectorization of text data makes it possible to locate semantically similar words, sentences, or documents within spatial proximity. For example, words like “mom” and “dad” should be closer than words like “mom” and “apple.” Since word vectors that emerge closest to the document vectors seem to best describe the topic of the document, the number of documents that can be grouped together represents the number of topics.
BERTopic builds upon the mechanisms of Top2Vec and provides document embedding extraction with a sentence-transformers model for more than 50 languages. BERTopic also supports UMAP for dimension reduction and HDBSCAN for document clustering. The main difference between Top2Vec is the application of a class-based c-TF-IDF algorithm, which compares the importance of terms within a cluster and creates term representation.
Results explanation of LDA and NMF
Starting from LDA, three hyperparameters are required. A grid search was performed for the number of topics (K) as well as for beta and alpha. The search for an optimal number of topics in our study started with a range from two to 15, with a step of one. During the process, only one hyperparameter varied, and the other remained unchanged until reaching the highest coherence score. To facilitate a clear interpretation of the extracted information from a fitted LDA topic model, pyLDAvis was used to generate an intertropical distance map.
As for NMF, an open-source Python library, Gensim, was used to estimate the optimal number of topics. By computing the highest coherence score, 10 topics could be identified in our research. Due to a clear distinction between all the identified topics in the NMF model (see detailed results in our paper), we conclude that the results obtained from NMF are more in line with human judgment, thereby outperforming LDA in general. Yet, as both models do not allow for an in-depth understanding of the phenomenon, the next section focuses on the topic models that use embedding representations.
Results explanation of BERTopic and Top2Vec
By relying on an embedding model, BERTopic and Top2Vec require an interactive process for topic inspection. Both algorithms allow researchers to discover highly relevant topics revolving around a specific term for a more in-depth understanding. Using Top2Vec for demonstration purposes, presuming that we are interested in the term “cancel” during COVID-19, the Top2Vec produces relevant topics based on the order of their cosine similarity, ranging from 0 to 1. Thereafter, the most important keywords for a particular topic can be retrieved. But, ultimately, an inspection of individual tweets is also highly recommended. For example, the keywords for the topic “cancel” include the following:
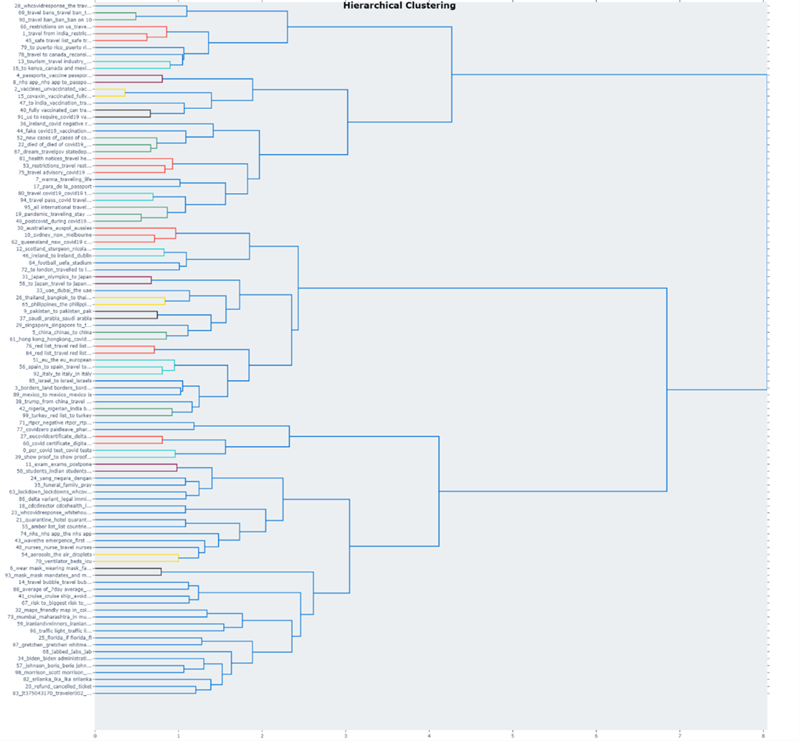
Turning to BERTopic, since some of the topics are close in proximity, visualization and topic reduction would provide a better understanding of how the topics truly relate to each other. To reduce the number of topics, hierarchical clustering can be performed based on the cosine distance matrix between topic embeddings. Our study took 100 topics as an example to provide an overview of how and to which extent topics can be reduced.
Conclusion
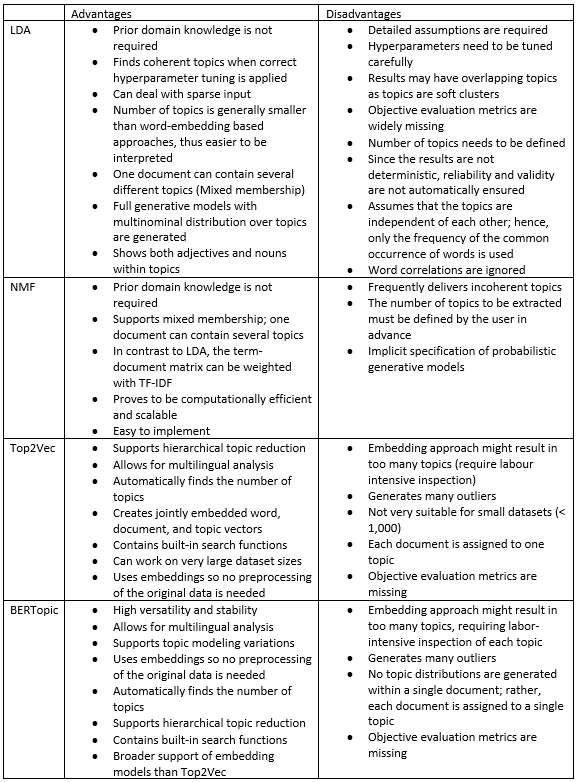
For an overall evaluation based on human interpretation, this study supports the potency of BERTopic and NMF, followed by Top2Vec and LDA, in analyzing Twitter data. While, in general, both BERTopic and NMF provide a clear cut between any identified topics, the results obtained from NMF can still be considered relatively “standard.” The table below summarizes the pros and cons of applying LDA, NMF, BERTopic, and Top2Vec in order to help facilitate social scientists in the necessary preprocessing steps, proper hyperparameter tuning, and comprehensible evaluation of their results. Please refer to our study for a complete step-by-step guide and detailed results.
How to cite: Egger, R., & Yu, J. (2022). A Topic Modeling Comparison Between LDA, NMF, Top2Vec, and BERTopic to Demystify Twitter Posts. Frontiers in Sociology, 7.
Transferring knowledge between academia and tourists has never been an easy task. Proportionally, the number of journal articles that describe empirical research is not increasing as rapidly as the amount of information shared on the Internet. With the rise of today’s visual-based social media, such as Instagram, shared content has the potential to offer new aspects of how visitors comprehend and appreciate a particular experience. Thus, our study takes the emerging phenomenon of dark tourism as the research context to provide solutions in revealing the knowledge discrepancies between academic publications and user-generated content.
Data extraction for academic publications and Instagram posts
Academic publications relevant to dark tourism were selected based on the top 10% of most frequently cited literature according to citation frequency on the Web of Science from the 1990s and onwards. Specifically, ‘dark tourism’ was used as a keyword, and the result was refined based on hospitality, leisure, and tourism categories. In total, 26 journal papers and two book chapters in English were selected. Thereafter, the whole paper (in pdf format) was parsed, and reference lists were removed using PyPDF2 in Python. Turning to Instagram data, we extracted Instagram posts captioned with the hashtag #darktourism. Data was crawled in March 2020 based on 26,581 public posts. After the removal of content shared by business accounts and non-English posts, the final dataset contained 12,835 posts published by 4,711 personal accounts. Extracted data included captions, the date of the post, the check-in location, and the post URL.
Both academic texts and Instagram captions were pre-processed using numerous natural language processing modules in Python. A list of stopwords was prepared, and non-informative texts were removed. Unknown characters, numbers, and usernames were excluded. Slang words were reformed, and diacritics were converted to the basic format. Finally, texts were tokenised into small units.
Geographic flow map
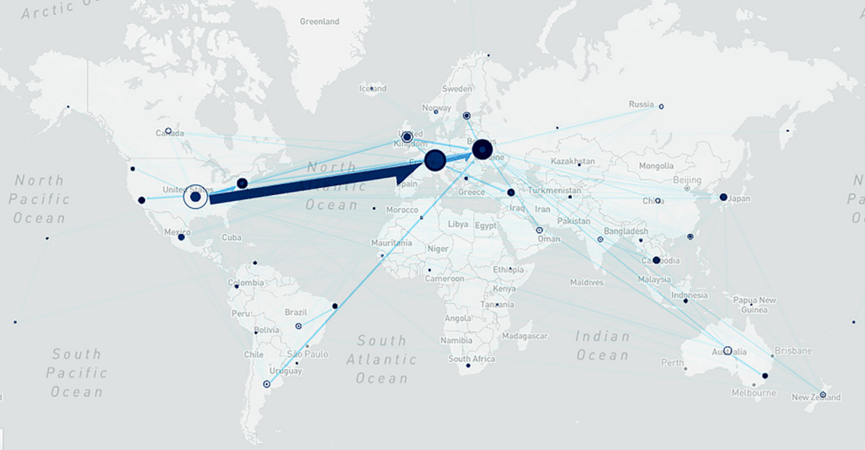
The study’s results start from a geographic flow map to visualise tourist movements and provide an overview of dark tourism spots based on the data. Based on the collected Instagram data, entity recognition was done in Python using Spacy to extract tourists’ country of origin from users’ Instagram profiles. The check-in location of a post is considered a tourist’s travel destination. The corresponding geographic coordinates of locations were identified using Google’s geocoding API, which resulted in 2,954 trips between pairs of tourists’ origin and travel destinations.
Concentric circles show where the tourists come from, and solid circles refer to the dark sites where tourists travelled to. The two major dark sites are in Ukraine (e.g., Pripyat and Chernobyl), with the major tourists to Ukraine coming from the UK, Argentina, and the USA. Readers who are interested in more details can refer to the interactive map on www.tinyurl.com/darktourismmapunder.
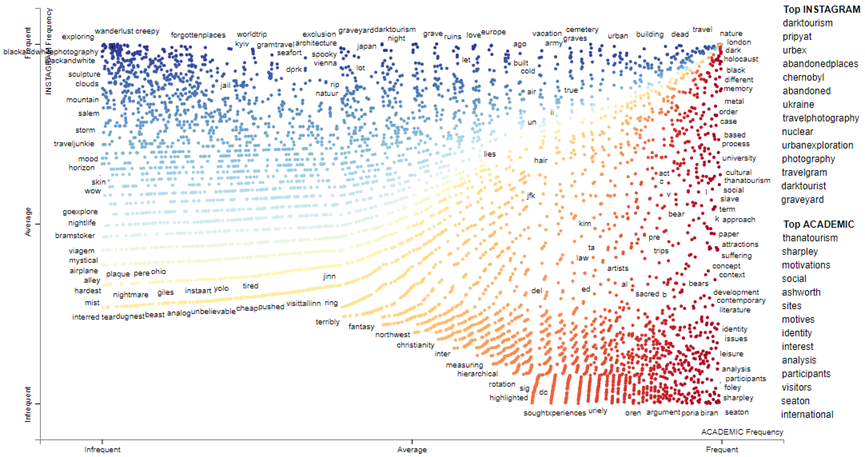
Scatterplot: Comparison between the viewpoints of scholars and tourists
This study visualises the highly associated terms that appeared in the top 10% of academic publications and Instagram posts using statistical natural language processing. The total word count for Instagram posts was 400,567, and for academic publications was 161,726. A model-based term scoring algorithm was applied to compute the association of the terms based on precision, recall, non-redundancy, and characteristicness. The terms were assigned to either one of the categories on a two-dimensional scatterplot (see Kessler (2017) for the complete mathematical procedure: https://arxiv.org/abs/1703.00565).
Each point represents the usage of a word based on its term frequencies, suggesting the plot coordinate for the word. The scatterplot also features a scaled F-score, ranging from −1 to +1. Words with scores near +1 are closer to the y-axis and are used more on Instagram (darker shades of blue); words with scores closer to −1 and the x-axis appear more in the literature (darker shades of red). If the terms present themselves more equally in both categories, the colour becomes more transparent. The top scoring terms unique in either one category are listed on the right side of the plot. Readers who are interested can refer to the interactive scatterplot URL: https://tinyurl.com/darktourismscatter
The scatterplot provides a snapshot of large and unstructured datasets by using statistical NLP to automatically compare documents in a language-independent way. In doing so, the interactive plot allows researchers to investigate topics and locations that are worth being looked at in a particular discourse based on the disclosure of authentic materials. Thus, it is shown whether the reality in tourists’ minds matches the research agendas and where unsolved thematic issues are revealed as relevant for future research directions.
Holistically, since texts are the dominant form of user-generated content, the example applied in our study (i.e., user-generated content vs academic publications) can be used to reveal common and uncommon ground across two categories in other contexts. For example, texts that can be contrasted and analysed in this way include the comparison between texts of tourists vs residents or domestic vs international travellers, amongst others.
How to cite: Yu, J., & Egger, R. (2022). Looking behind the scenes at dark tourism: a comparison between academic publications and user-generated content using natural language processing. Journal of Heritage Tourism, 1-15.
by Dirk Schmücker and Julian Reif Paper: Measuring tourism with big data? Empirical insights from comparing passive GPS data and passive mobile data. In: Annals of Tourism Research Empirical Insights 3(2022)
Currently, there are two valid approaches for measuring tourism frequencies and flows: (a) locally installed one-spot sensors and (b) tracking solutions based upon signal chains coming from GNNS-equipped smartphones or the mobile network they are connected to. There are some more variants of data-sources, for example, „mini-signal chains“ (constructed from local sensors catching the Bluetooth or wifi signal or public social media postings) or using water consumption in a destination, but basically, there are these two approaches: Local sensors and smartphone-based tracking. In this article, we deal with smartphone-based tracking data.
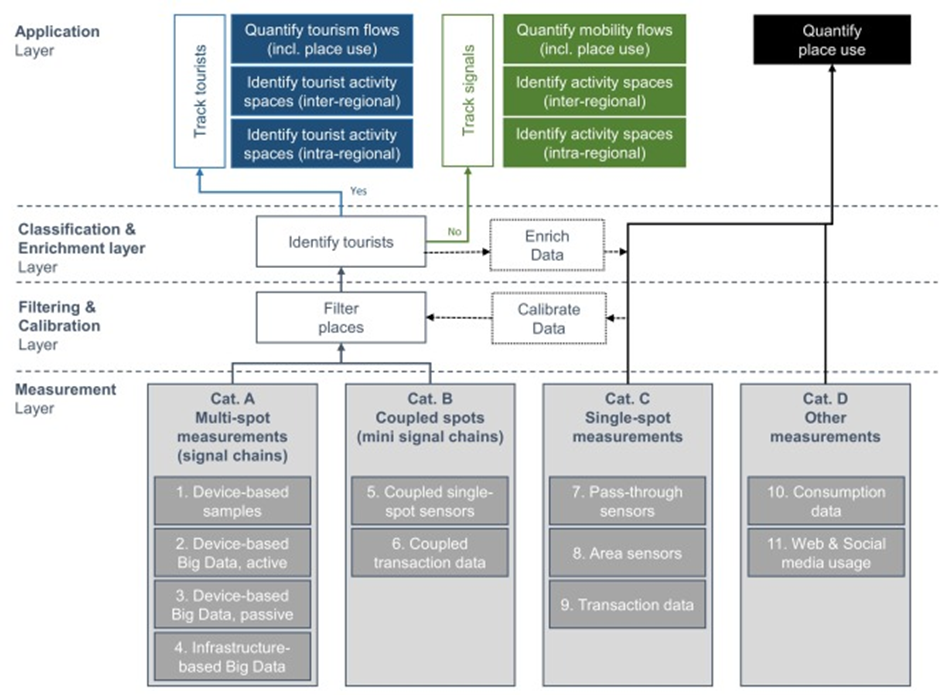
In the first step, we tried to identify and classify the different data sources relevant to tourism research. For this purpose, we propose four categories in the paper:
Cat. A: Multi-Spot Measurements
Cat. B: Coupled Spots
Cat. C: Single Spot Measurements
Cat. D: Other Measurements
In order to better compare the data sources, we have also developed a set of 13 evaluation indicators summarized in four dimensions (Figure 1):
Figure 1: Categories of data sources
Specific tourist dimensions
Time and Space
Generic dimensions
Social and organizational dimensions
In addition to this more theoretical look at the subject, we work with empirical data and more precise Tracking Data. Tracking data are Big Data in terms of being 3V and also in terms of being „exhaust data“: These data are not being generated with the goal of tracking users, but for billing, technical operations or finding one’s place to get the correct weather forecast. However, once the data is there, why not reuse them? This idea has turned into a vibrant industry, and datasets are commercialized for considerable sums of money.
There is a growing body of academic research on such data sources, and researchers usually do fancy things within the data, mostly applying advanced ARIMA models or some machine learning algorithms. We were more interested in the relation of the data sources to the real world: Would they be able to reflect the results from reference data sources, and would they be able to identify different types of mobility?
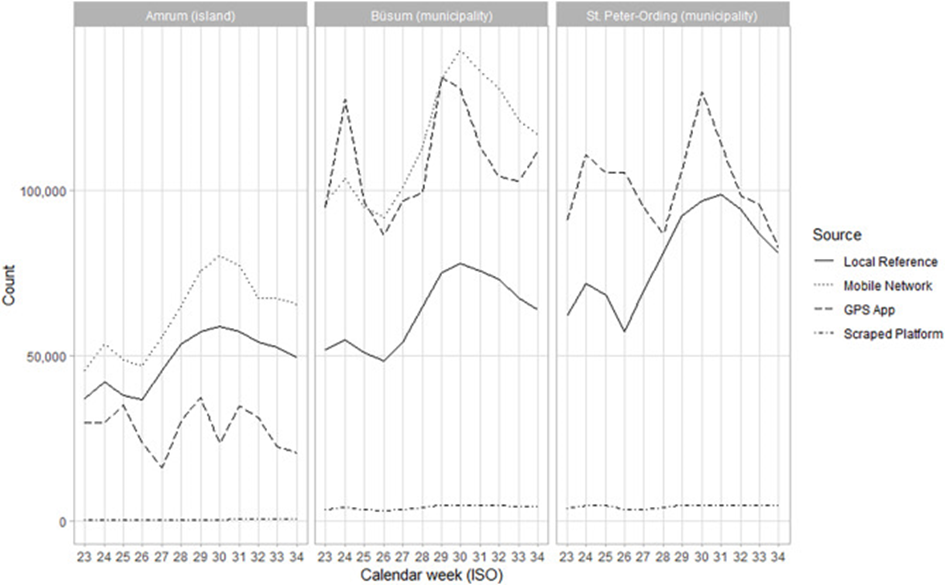
Therefore, we use two data sources (passive mobile phone data and passive GPS location events) to get empirical insights on day and overnight tourists in four different destinations in Schleswig-Holstein, Germany (St. Peter-Ording, Büsum, Amrum, Multimar Wattforum). We compare Big Data with local reference data from tourist destinations. Figure 2 shows an example of a visual comparison of different data sources for overnight visitors. Results show that mobile network data are on a plausible level compared to the local reference data and are able to predict the temporal pattern to a very high degree. GPS app-based data also perform well but are less plausible and precise than mobile network data.
Figure 2: An example of comparing different data sources for overnight tourists