
by Joanne Yu & Roman Egger
Full paper published by: Joanne Yu and Roman Egger, Journal of Heritage Tourism, https://doi.org/10.1080/1743873X.2022.2097011
Transferring knowledge between academia and tourists has never been an easy task. Proportionally, the number of journal articles that describe empirical research is not increasing as rapidly as the amount of information shared on the Internet. With the rise of today’s visual-based social media, such as Instagram, shared content has the potential to offer new aspects of how visitors comprehend and appreciate a particular experience. Thus, our study takes the emerging phenomenon of dark tourism as the research context to provide solutions in revealing the knowledge discrepancies between academic publications and user-generated content.
Data extraction for academic publications and Instagram posts
Academic publications relevant to dark tourism were selected based on the top 10% of most frequently cited literature according to citation frequency on the Web of Science from the 1990s and onwards. Specifically, ‘dark tourism’ was used as a keyword, and the result was refined based on hospitality, leisure, and tourism categories. In total, 26 journal papers and two book chapters in English were selected. Thereafter, the whole paper (in pdf format) was parsed, and reference lists were removed using PyPDF2 in Python. Turning to Instagram data, we extracted Instagram posts captioned with the hashtag #darktourism. Data was crawled in March 2020 based on 26,581 public posts. After the removal of content shared by business accounts and non-English posts, the final dataset contained 12,835 posts published by 4,711 personal accounts. Extracted data included captions, the date of the post, the check-in location, and the post URL.
Both academic texts and Instagram captions were pre-processed using numerous natural language processing modules in Python. A list of stopwords was prepared, and non-informative texts were removed. Unknown characters, numbers, and usernames were excluded. Slang words were reformed, and diacritics were converted to the basic format. Finally, texts were tokenised into small units.
Geographic flow map
The study’s results start from a geographic flow map to visualise tourist movements and provide an overview of dark tourism spots based on the data. Based on the collected Instagram data, entity recognition was done in Python using Spacy to extract tourists’ country of origin from users’ Instagram profiles. The check-in location of a post is considered a tourist’s travel destination. The corresponding geographic coordinates of locations were identified using Google’s geocoding API, which resulted in 2,954 trips between pairs of tourists’ origin and travel destinations.
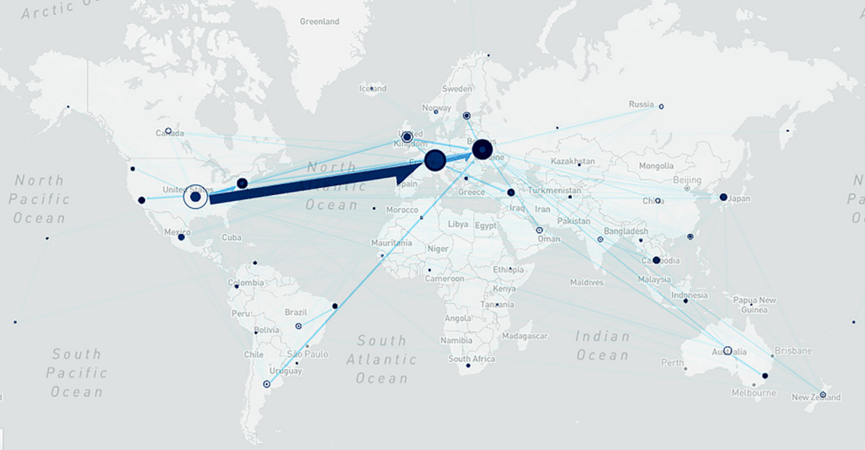
Concentric circles show where the tourists come from, and solid circles refer to the dark sites where tourists travelled to. The two major dark sites are in Ukraine (e.g., Pripyat and Chernobyl), with the major tourists to Ukraine coming from the UK, Argentina, and the USA. Readers who are interested in more details can refer to the interactive map on www.tinyurl.com/darktourismmapunder.
Scatterplot: Comparison between the viewpoints of scholars and tourists
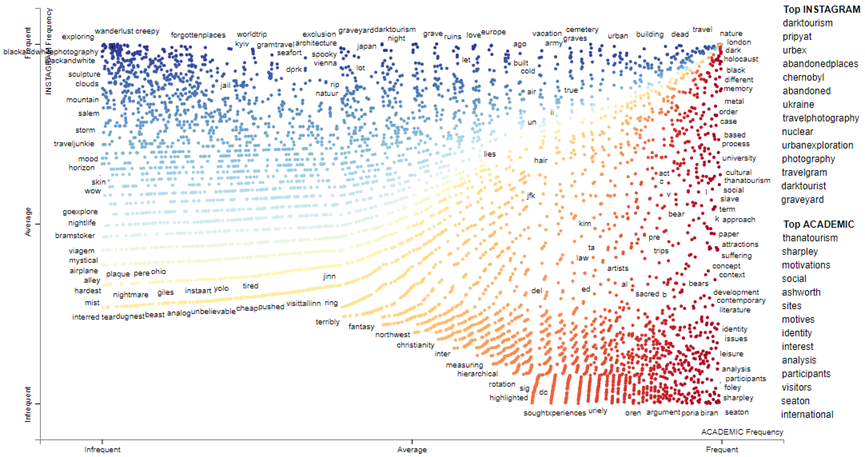
This study visualises the highly associated terms that appeared in the top 10% of academic publications and Instagram posts using statistical natural language processing. The total word count for Instagram posts was 400,567, and for academic publications was 161,726. A model-based term scoring algorithm was applied to compute the association of the terms based on precision, recall, non-redundancy, and characteristicness. The terms were assigned to either one of the categories on a two-dimensional scatterplot (see Kessler (2017) for the complete mathematical procedure: https://arxiv.org/abs/1703.00565).
Each point represents the usage of a word based on its term frequencies, suggesting the plot coordinate for the word. The scatterplot also features a scaled F-score, ranging from −1 to +1. Words with scores near +1 are closer to the y-axis and are used more on Instagram (darker shades of blue); words with scores closer to −1 and the x-axis appear more in the literature (darker shades of red). If the terms present themselves more equally in both categories, the colour becomes more transparent. The top scoring terms unique in either one category are listed on the right side of the plot. Readers who are interested can refer to the interactive scatterplot URL: https://tinyurl.com/darktourismscatter
The scatterplot provides a snapshot of large and unstructured datasets by using statistical NLP to automatically compare documents in a language-independent way. In doing so, the interactive plot allows researchers to investigate topics and locations that are worth being looked at in a particular discourse based on the disclosure of authentic materials. Thus, it is shown whether the reality in tourists’ minds matches the research agendas and where unsolved thematic issues are revealed as relevant for future research directions.
Holistically, since texts are the dominant form of user-generated content, the example applied in our study (i.e., user-generated content vs academic publications) can be used to reveal common and uncommon ground across two categories in other contexts. For example, texts that can be contrasted and analysed in this way include the comparison between texts of tourists vs residents or domestic vs international travellers, amongst others.
How to cite: Yu, J., & Egger, R. (2022). Looking behind the scenes at dark tourism: a comparison between academic publications and user-generated content using natural language processing. Journal of Heritage Tourism, 1-15.