Category Archives: Blog

Identifying hidden semantic structures in Instagram data: A topic modelling comparison about darktourism

by Joanne Yu & Roman Egger

Full paper published by: Roman Egger and Joanne Yu, Tourism Review,
https://doi.org/10.1108/TR-05-2021-0244

Have you ever wondered how to analyse caption text on Instagram? Texts shared on Instagram are typically more complex. Compared to blogs, newsletters, or online comments, the textual content of Instagram posts mainly consist of very short texts and is unstructured by nature.

From a marketing viewpoint, although we are all aware of the potential in generating insights from Instagram in order to better understand consumer experiences, the complexity of texts often is the biggest hurdle for marketers to analyse Instagram content. In our study, we present three topic modelling approaches in analysing Instagram textual data. We evaluate latent Dirichlet allocation (LDA), correlation explanation (CorEx), and non-negative matrix factorization (NMF) to support the decision-making when selecting appropriate techniques.

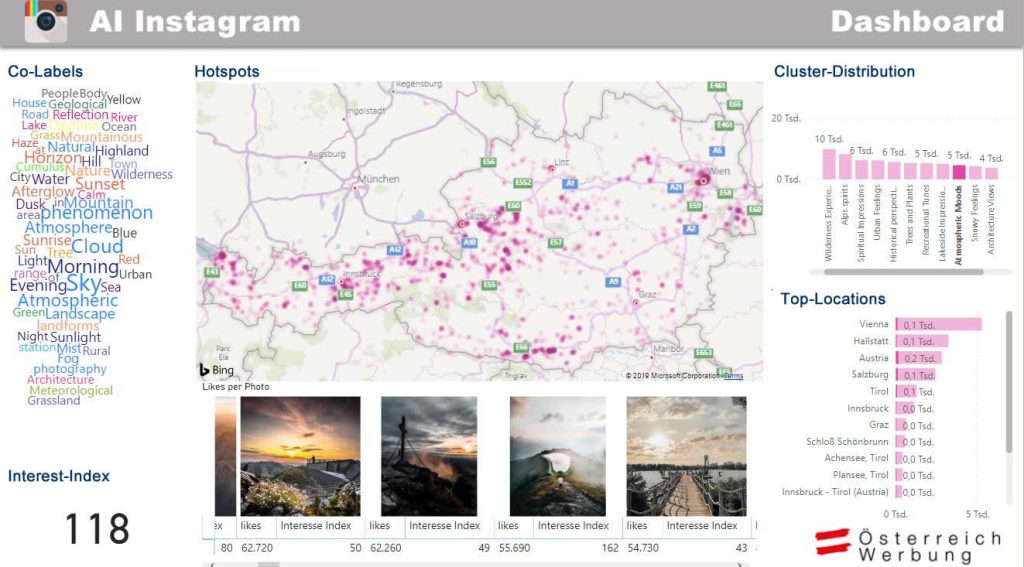
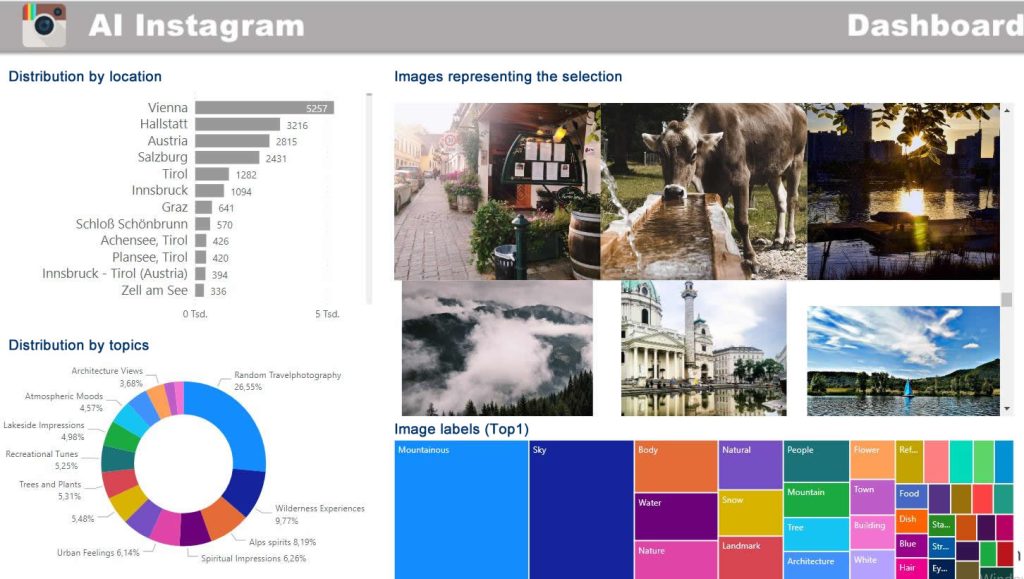
To provide an overview of the three topic modelling techniques, our study applies dark tourism experiences as the study context based on narratives shared on Instagram. A total of 26,581 public posts tagged with #darktourism were crawled. After data cleaning, we analysed 12,835 posts published by 4,711 personal accounts. Data were then pre-processed and transformed into vectors.

Introduction to LDA, CorEx, and NMF

Among several types of topic models, LDA is agreed as the most popular algorithm. Its core strength is that the algorithm can infer the latent topic structure where no predefined classes are required. Through an iterative process, words are re-assigned to a topic until convergence. However, one major flaw lies in its high dependence on words and their frequency in a corpus, which may result in overlapping clusters.

In addition to LDA, CorEx is a newly semi-supervised approach used in recent social media research. CorEx is based on an information-theoretic framework, suggesting a process of gaining information when the outcome is unknown before the analysis. Thus, it searches for informative representations that can best explain certain phenomena. Another strength is that CorEx provides the model with anchor words. This flexibility allows researchers to develop creative strategies and enforces topic separability.

Finally, we introduce NMF in the study. NMF is a linear-algebraic model capable of improving topic coherence. One advantage of NMF is that it can transform sparse data into a dense matrix without losing latent information. That is, when learning in noisy domains (e.g., social media), NMF can detect meaningful topics without prior knowledge of the original data.

Process and evaluation of LDA

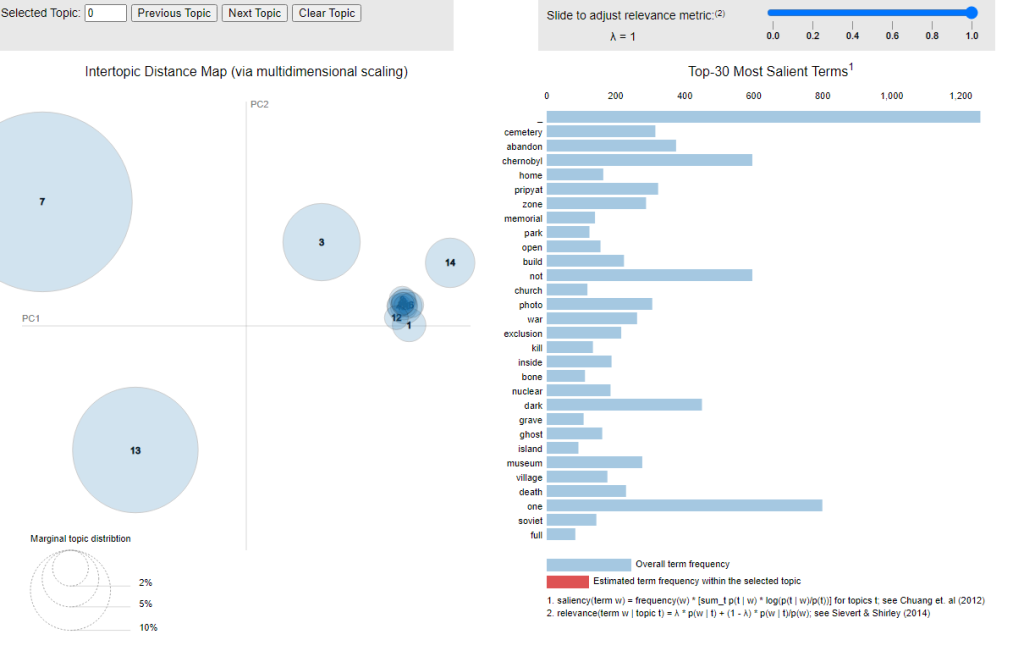
First, a grid search on three essential hyperparameters (number of topics (K), alpha, beta) was performed. To identify the optimal hyperparameters, one always varies and the other hyperparameters remain constant. After running several experiments, the best coherence score with 15 topics, was reached. Next, the grid search yielded a symmetric alpha value and a beta value of 0.91. However, through a visual inspection using an intertropical distance map with pyLDAvis, several overlapping topics were identified. An example can be seen from the figure below. For readers who are interested, an interactive visualisation of the overlapping topics can be seen at https://tinyurl.com/darkt-LDA. Thus, we conclude that LDA cannot determine a suitable topic solution.

Process and evaluation of NMF

In NMF, the two factors – W and H – are always nonnegative, minimising the risk of interpreting topics with negative entries for certain words. Typically, researchers approximate the factors, although there is no guarantee whether the input matrix can be recovered. That is, the number of subjects needs to be determined in advance. In our study, Gensim was used to estimate the optimal number of topics.

Although seven topics (without overlapping) could be identified, human judgment concluded that the topics were not specific enough for meaningful implications. After all, while NMF appears to perform better than LDA, NMF model only contains a small number of topics. Because NMF relies on the Frobenius norm, word weights are not probability distributed. In this case, the findings suffer from a poor-quality model where multiple topics are merged into one.

Process and evaluation of CorEx

The number of topics for CorEx depends on the distribution of total correlation. After comparing different numbers of extracted topics, the inspection in our study returned a 17- topic solution with the highest correlation. To effectively extract latent factors, incorporating domain knowledge through anchor words could be used. Assessing the strength of anchor words facilitates researchers to decide to what extent the words are related to a topic. Because the evaluation of anchor words corresponds to a more advanced theory- or domain-knowledge-driven approach (which is not present in LDA and NMF), this step was not proceeded in the research.

Which one works the best?

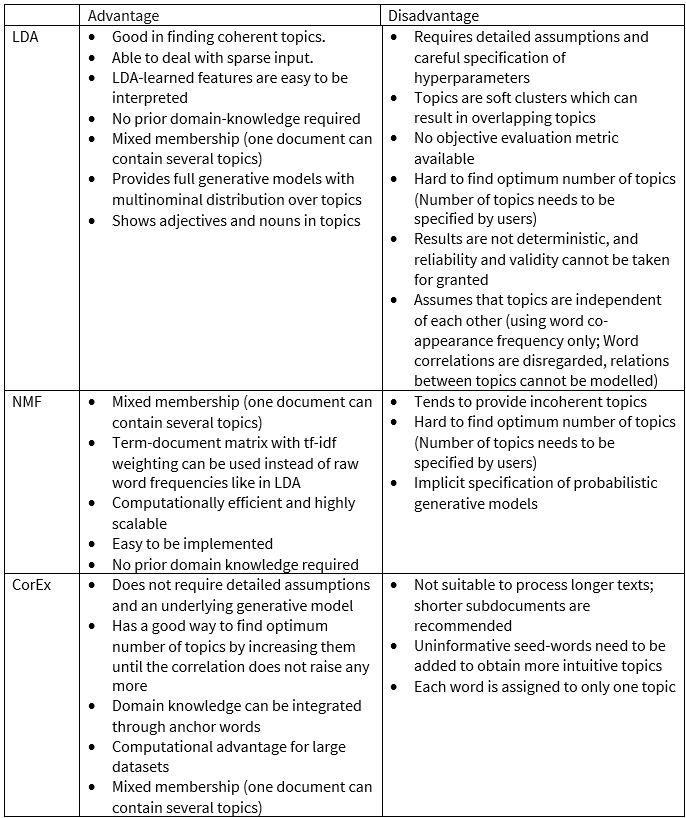
In a nutshell, we support the effectiveness of CorEx in uncovering hidden insights when processing Instagram data. However, it is important to keep in mind that there is no “best” topic modelling technique because the performance may vary, depending on the nature of the data sets. Meanwhile, because topic modelling still serves as a means for qualitative research, human judgement and interpretation are of high relevance. Below we summarise the advantages and disadvantages of the individual approach.

How to cite: Egger, R., & Yu, J. (2021). Identifying hidden semantic structures in Instagram data: a topic modelling comparison. Tourism Review, ahead-of-print.

A Machine Learning Approach to Cluster Destination Image on Instagram

by Joanne Yu & Roman Egger

Full paper published by: Veronika Arefieva, Roman Egger, and Joanne Yu, Tourism Management, https://doi.org/10.1016/j.tourman.2021.104318

Open Acces – download the full paper here

Unlike previously, where the image of a destination is typically formed by tourism marketers, visual-centered social media platforms such as Instagram have dramatically changed the tourism industry and the way we travel. As a holiday planning tool, Instagram photos not only hint at how tourists associate and interpret the destination but also reproduce symbols with socially constructed meanings.

But wait… if you do a simple search for any destination on Instagram, they mostly have thousands, if not millions, of pictures posted by countless users. In the research, we provide a solution for how the destination image can be investigated in a data-rich environment.

Destination management organizations (DMOs) face the problem that they only know their own perceived image. They promote their country’s attractions without knowing how and about what tourists communicate. We were therefore interested in the question of what perceived image tourists have of Austria. The aim was to carry out topic analyses based on a clustering of images. In this way, and in combination with the geodata from the Instagram posts, we would see which themes are in vogue, and where in Austria. This information can then be used by DMOs to identify “white spots”, i.e. themes that are of interest to tourists, but which are not advertised by the destination, just because one was not aware of this up to now.

In our study, a total of 101,870 posts based on the hashtag #visitaustria, #feelaustria (these are the official hashtags from the destination management organization), and “#travel + #austria” were analysed. The data was preprocessed and all images were labelled by using the Google Cloud Vision API. So we retrieved a textual description of each image. Based on this text and the metadata from each post, we applied geoanalytics and three machine learning techniques; 1) k-means clustering based on document-term matrix, 2) correlation explanation (CorEx) topic model based on document-term matrix, and 3) k-means clustering based on Doc2Vec vectors, to evaluate how tourists associate their experiences on Instagram based on pictorial content. Detailed descriptions for each of the machine learning model follow.

Model 1: K-means clustering based on document-term matrix

A document-term matrix describes the frequency of terms occurring in a collection of documents, and the values of the matrix are tf-idf, which suggests the importance of a word in the documents. The resulting matrix was then clustered with the k-means algorithm. Based on the silhouette score, the best model returned 15 clusters. To provide a better cluster separation, the authors tested hierarchical approaches with the following model configurations: a single-layer model with 15 clusters, a hierarchical 2-layer model with 58 and 15 clusters, respectively, and a hierarchical 3-layer model with 58, 28 and 14 clusters. The cluster number on each layer was chosen using silhouette and inertia scores.

Model 2: CorEx topic model based on document-term matrix

CorEx algorithm maximizes the informativeness of the text data and allows the anchoring of words. The authors first constructed several single-layer and hierarchical models with three as a maximum number of layers. To enable manual result comparison with k-means models, the top layers of each CorEx model contained a cluster number of 15. To that end, the authors implemented one single-layer model with 15 clusters and a hierarchical 3-layer model with 58, 36 and 15 clusters on each layer, respectively. An appropriate cluster number for each layer was then selected based on total correlation.

Model 3: K-means clustering based on Doc2Vec vectors

A Doc2Vec model was used to produce 100-dimensional vectors for each photo. Meanwhile, a tourism domain-specific corpus was created based on 3.6 million reviews of tourism sights worldwide to formulate the Doc2Vec model. Next, three k-means models for 10, 15 and 20 clusters were tested using cosine distance to compute similarity. However, the authors reported that the cluster separation was unsatisfactory, resulting in several repetitive topics. One potential reason is that because the authors used the most frequent words in the documents belonging to the same cluster, the cluster descriptions were not well-separated. On a more general level, another issue causing poor performance is because the time-consuming process since Doc2Vec vectors need intensive parameter tuning.

The Take-away

Suggested by the authors, “k-means clustering based on document-term matrix offers the most satisfying results whereas using Doc2Vec techniques is the least recommended approach for clustering text data.” The use of three machine learning approaches provides a guideline for tourism organisations to uncover the destination image presenting on Instagram to optimise their marketing contents. By using “ready-to-use” frameworks (i.e., graphical images on Instagram), the presented models are already generalised algorithms which could be applied to any kind of data in textual form.

The authors conclude that the highest concentration of the photographs was in Austria’s most popular cities such as Vienna, Hallstatt, and Salzburg, as well as around national and nature parks, and around the Alps region. Another more specific example can be seen in the figure below. For pictures clustered as “atmospheric moods”, the findings show that most of the photos were taken in Vienna and the lake district close to Salzburg. Relevant visual contents of “atmospheric moods” photographs include sunset, afterglow, and dusk.

A dashboard allows to search for certain topics, like “athmospheric moode” in the figure above. A map then shows where these topics exist, naturally in the mountains (e.g. clouds, sunset) and in the lakes regions (e.g. fog, sunset).

In summary, data-driven approaches allow better understanding of the market by identifying white spots and optimising marketing communications. Recognising the importance of visual content displayed on Instagram would allow marketers to further identify new attractions where the majority of tourists might be unaware of before. By involving tourists in marketing content generation, the methodological techniques presented in this study optimises the cost and time effectiveness for destination marketers.

How to cite: Arefieva, V., Egger, R., & Yu, J. (2021). A machine learning approach to cluster destination image on Instagram. Tourism Management85, 104318.

What is Zero-Shot Classification?

by Roman Egger

As described in detail in chapter 10 (Classification), for a classification task you need labeled data as training data. Let’s assume we have three different classes “hotel”, “tourist” and “travel agency”. This data can be text data or images, for example. But what if the learner finds among the test data examples of classes that were not present during the training. We humans are usually very good at recognizing things and classifying them correctly, even if we have never seen them before. In zero shot learning (ZSL), observed and unobserved classes are related by auxiliary information and difference features are identified. For images, a description about the appearance of objects can help distinguish one class from another, even if no examples of the unknown class were present in the training data. An example often used for explanation is that between horses and zebras. A human would be able to distinguish a zebra from a horse even if he had never seen a zebra, provided the auxiliary information that zebras are black and white striped was known. Auxiliary information can be, for example, attibutes and metadata, text descriptions, or vectors of word category labels.

ZSL occurs in two steps: First, knowledge about attributes is acquired during training. Then, in the second step of inference, the knowledge is used to partition instances into new categories. Natural Language Inference (NLI) examines whether a hypothesis for a given premise is true (consequent), false (contradictory), or indeterminate (neutral).


Another example would be, if we want to predict the sentiment between the positive and negative groups for the example sentence “I love the city of Salzburg”, this can be tested as follows:

Premise: I love the city of Salzburg
Hypothesis 1: This example is positive.

Premise: I love the city of Salzburg
Hypothesis-2: This example is negative.

Now, for each class, a hypothesis template such as “This example is….” is created to predict the correct class for the premise. If the inference is a consequence, the premise belongs to that class. In this case positive.

Now let´s have a look how we can easily implement Zeros Shot Classification for Texts using Huggingface in just two lines of code.

classifier = pipeline("zero-shot-classification")

classifier("Data Science is altering the tourism industry", candidate_labels=["Business",'Politics', 'Technology'])

We use the “zero-shot-classification” pipeline from Huggingface, define a text and provide candidate labels. For this task, the NLI-based zero-shot classification pipeline was trained using a ModelForSequenceClassification. Numerous available models can be used to fine-tune the NLI task. In this case, the sentence “Data Science is altering the tourism industry” should be correctly classified in one of the following classes “Business”, “Politics”, or “Technology”. The output shows us the probability scores for each category.

{'sequence': 'Data Science is altering the tourism industry',
 'labels': ['Technology', 'Business', 'Politics'],
 'scores': [0.6754791140556335, 0.2831524610519409, 0.04136836156249046]}

I can also recommend CLIP from Openai, a neural network that learns visual concepts from natural language supervision. CLIP can be used for any visual classification benchmark by simply providing the names of the visual categories to be recognized.