by Joanne Yu & Roman Egger
Full paper published by: Joanne Yu and Roman Egger, Annals of Tourism Research, https://doi.org/10.1016/j.annals.2021.103204
Have you ever thought about why you ‘liked’ and ‘commented’ on some of the photos on Instagram, and some not? Certainly, content matters. However, when you need to browse through hundreds of Instagram posts, one of the subtle factors that may unconsciously influence your behavior is the color of the image. Color, as one of the major components in tourism aesthetics, influences human physiological responses and leads to changes in our online behavioral reactions.
Yet, the interplay between pictorial content and user engagement remains unclear and difficult to investigate. Our study applies a machine learning approach in order to investigate the role of color in influencing user engagement on Instagram based on tourism pictures with different features.
A six-step methodological procedure
Step 1 Picture selection: To identify tourism photos as the data sources on Instagram, the most commonly mentioned typologies summarized by previous literature were treated as hashtags to facilitate the data crawling process. They include “#beach”, “#mountain”, “#heritage”, “#forest”, “#gastronomy”, “#temple”, “#lake”, “#museum”, and “#cityscape”.
Step 2 Data extraction: A total of 7,887 public posts published between 2017 and 2019 were crawled, including the date, page URLs, image URLs, username, and the number of likes and comments. Yet, because engagement rate changes logarithmically, data was re-collected from the page URLs after 14 days of the first data extraction. After excluding the posts removed by the users, the final dataset contained 4,757 pictures.
Step 3 Image annotation and clustering: Because hashtags do not necessarily reflect the pictorial content (e.g., one might post a selfie with #mountain when hiking), we re-assigned the extracted pictures. Specifically, the image labels (i.e., the entities of a picture such as general objects, locations, activities, and animal species) annotated by Google Cloud Vision API were transformed into vectors using tf-idf value, indicating to what extent a label contributes to a picture. Next, the Louvain algorithm was applied to convert the detected labels into several clusters based on highly interconnected nodes (entities in the data). The image labels were considered as the edges (relationships between those entities) that connect different pictures, forming an image-network-graph and leading to a clustering of highly-connected images.
Step 4 Calculation of engagement rate: The next step was to calculate the average engagement rate of each identified cluster by taking the total number of likes and comments of a post and dividing it by a given user’s follower numbers.
Step 5 Color conversion: Google Cloud Vision was applied to detect a picture’s dominant colors. Cloud Vision returned up to 10 RGB values and their representative scores for each image. To ensure that the color presented is in line with human visual perception, RGB color codes were converted to hue, resulting in 12 major colors: orange, orange-yellow, yellow, yellow-green, green, blue-green, blue, blue-violet, violet, violet-red, red, and red-orange. Finally, to attain the percentage of color across the entire image, an individual color’s score was divided by the sum of all the scores returned from Cloud Vision.
Step 6 Implementation of machine learning methods: To analyze the relationship between color and the engagement rate of each cluster, auto machine learning with SVM and random forest was conducted. The engagement rate was selected as the target variable, and the color attributes were treated as input variables for prediction. Note that only the attributes that would contribute most to the quality of the resulting model were selected.
SVM and random forest were implemented based on the automatic optimization feature, optimizing the number of trees for the random forest and the gamma and C hyperparameter for SVM. The contribution of the model’s selected color was ranked based on weight vectors, which were calculated using a local interpretable model explanations (LIME) method. Specifically, LIME generates random samples around neighboring inputs and finds correlation weights for each input in the dataset. By summing up the weights of the color attributes based on their extent of contribution to engagement rate, a final output is given.
An overview of the results
The Louvain algorithm generated 24 image clusters. The labels with the highest tf-idf value were included as keywords to facilitate the naming process of each cluster. Concerning the effects of color, since the accuracy score of SVM was better than the random forest’s in most of the cases (by evaluating MSE and RMSE), the results from SVM were presented.
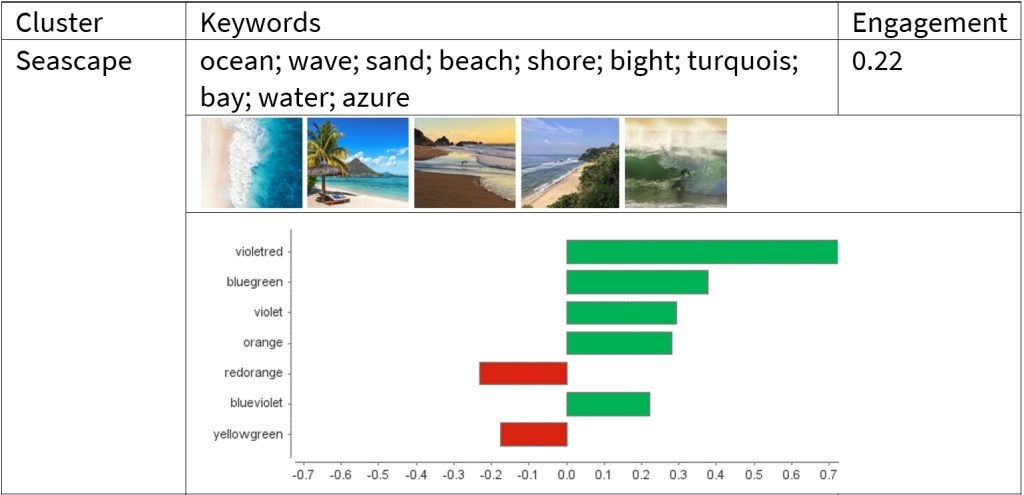
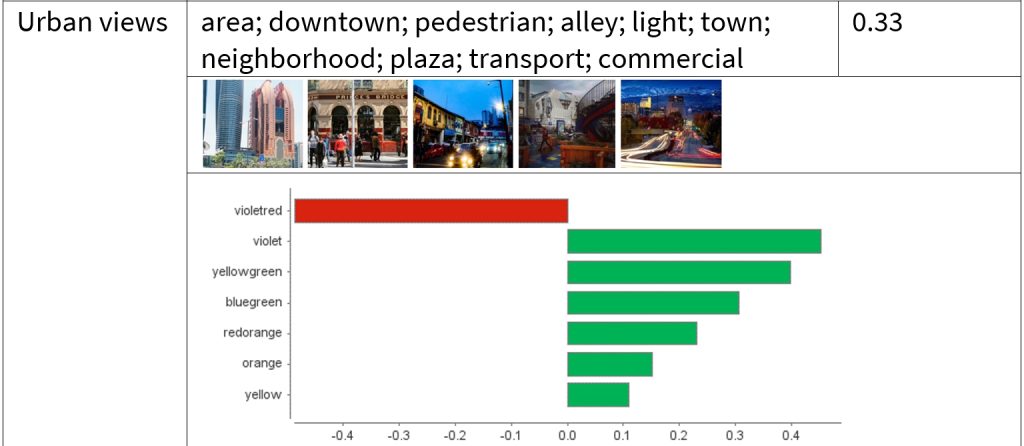
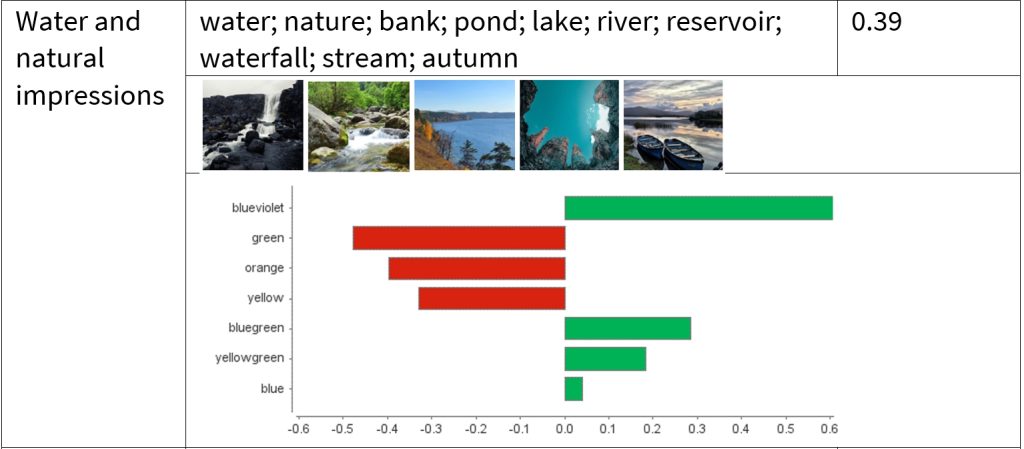
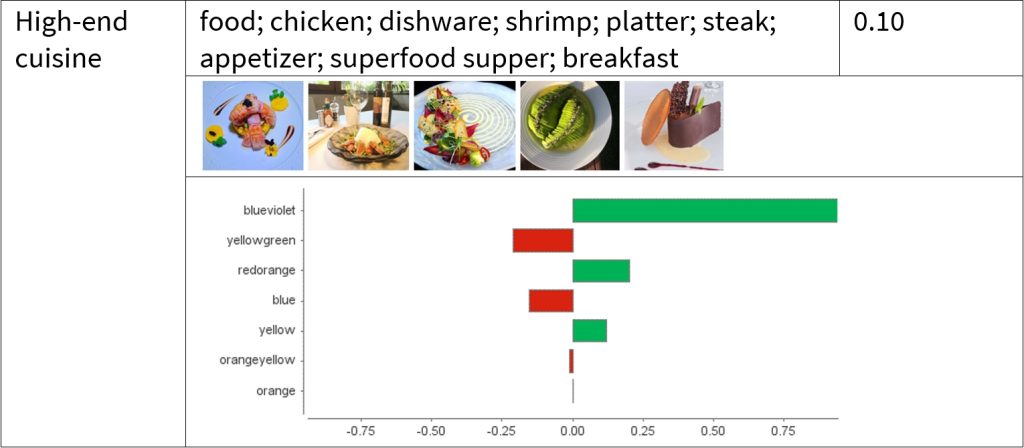
The table below provides four image clusters as examples, followed by the results of SVM. Notably, LIME used in SVM returns local weights and only focuses on the most relevant ones. For instance, violet has the highest weight in “urban views”, while violet-red conquers in “seascape” and blue-violet in “water and natural impressions” and “high-end cuisine”. Take “high-end cuisine” as an example, to achieve the highest engagement rate possible within this cluster, a picture should be composed more of blue-violet shades while slightly minimizing yellow-green and blue touches. The detailed results can be found in our paper.
Overall, applying SVM to Instagram data offers a new form of analysis for tourism and digital marketing. Our study provides a hands-on guide for marketers to bring images presented on Instagram to light in order to optimize their marketing content based on consumers’ preferences and interests. Meanwhile, our research provides some indications as to where and how future studies could collect data in a more structured fashion.
How to cite: Yu, J., & Egger, R. (2021). Color and engagement in touristic Instagram pictures: A machine learning approach. Annals of Tourism Research, 103204.