By its very nature, tourism is closely linked to geospatial data. Nevertheless, publications dealing with geo-analytical issues are rather the exception in tourism literature. This is probably due to the fact that geographers if they publish in a tourism context, tend to publish in their geo-community rather than in tourism-related journals. This is also the reason why I have included this topic in the book under chapter 24. Andrei Kirilenko provides insights into basic terminology, typical problems and methodological approaches to make them accessible to tourism researchers. I, too, have been dealing with geodata to a greater or lesser extent for some time and would like to present an exciting method for tourism at this point. Geodata is available to us either through observation, GPS tracking (see our study in the city of Salzburg or the study of the “Freilichmuseum”, I did with my students), recently also increasingly through the use of mobile phone data. In this example, I use GPS data from mobile devices of tourists in Salzburg (3 Months in 2019), I received from NEAR. NEAR sells GPS data from 1,6 billion users in 44 countries, with 5 billion events processed per day. So this easily becomes real big data!
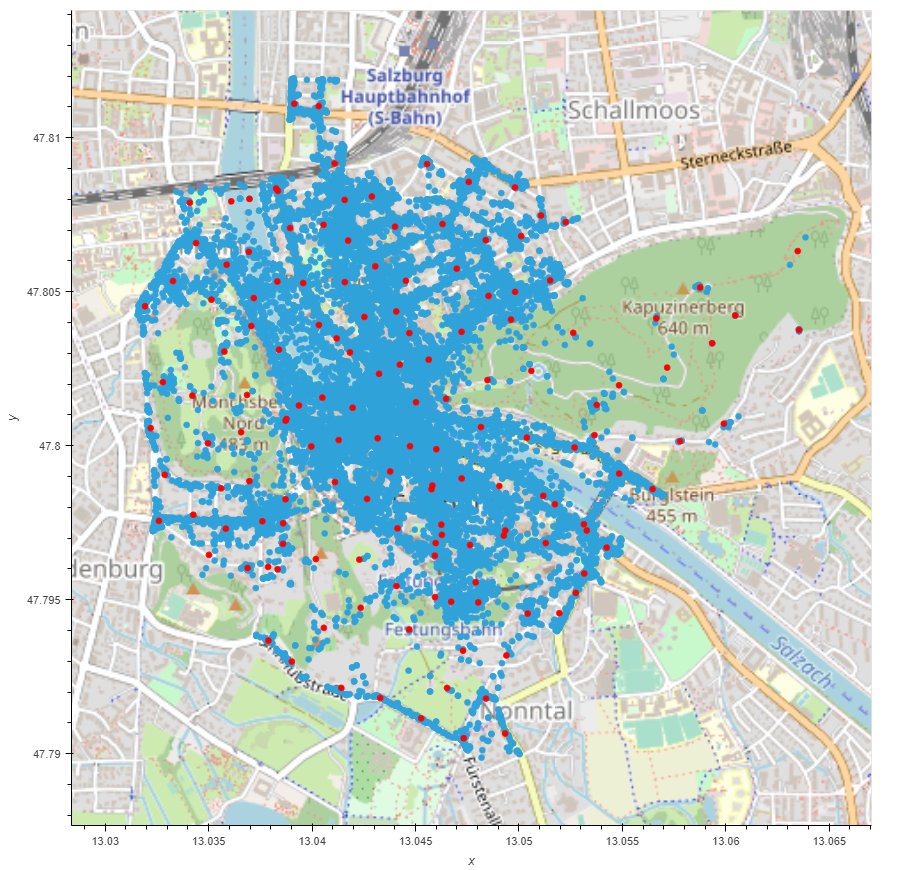
On the one hand, these data can be segmented according to the markets of origin in order to identify a possibly different behavior of the markets. For city destinations, however, the movement patterns of tourists are of particular interest. So what are the destination’s “beaten tracks” – questions that are particularly relevant in destinations struggling with the overtourism phenomenon.
The first graphic shows the available GPS data of tourists in the city of Salzburg. In addition, red dots can be seen.
German Tourists (2019)
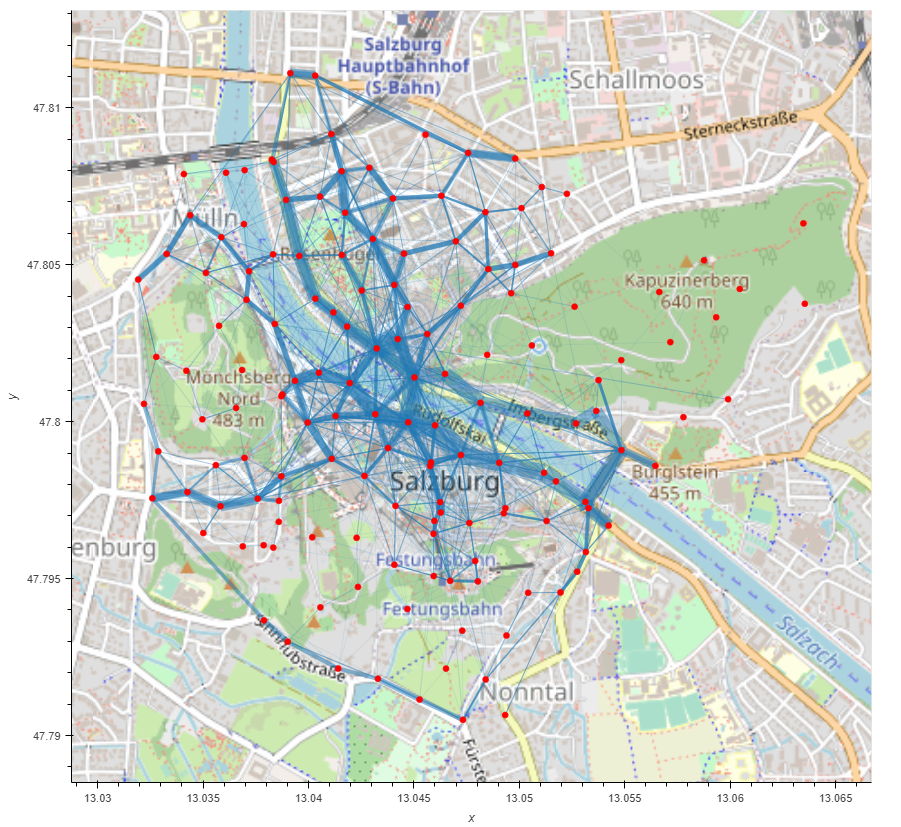
Here I used the Python Library “MovingPandas” by Anita Graser. Cluster points are created and subsequently, the frequency between the points can be visualized.
The thicker the line, the more frequented the distance between the two clusters. Thus, it can be visualized very well how tourists navigate through the city. Unfortunately, MovingPandas still lacks the possibility to adjust the edges to the streets, so that the lines go across the river or over buildings. Nevertheless, it is an exciting approach to capturing typical moving patterns of tourists.
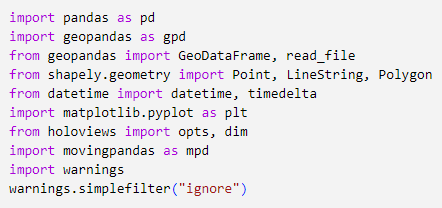
And this is how it´s done (code adapted from Anita´s examples):
df = # load your dataset with columns “Latitude”, “Longitude”
crs = {‘init’: ‘epsg:4326’} # assign CRS
geometry = [Point(xy)for xy in zip(df[‘Longitude’], df[‘Latitude’])]
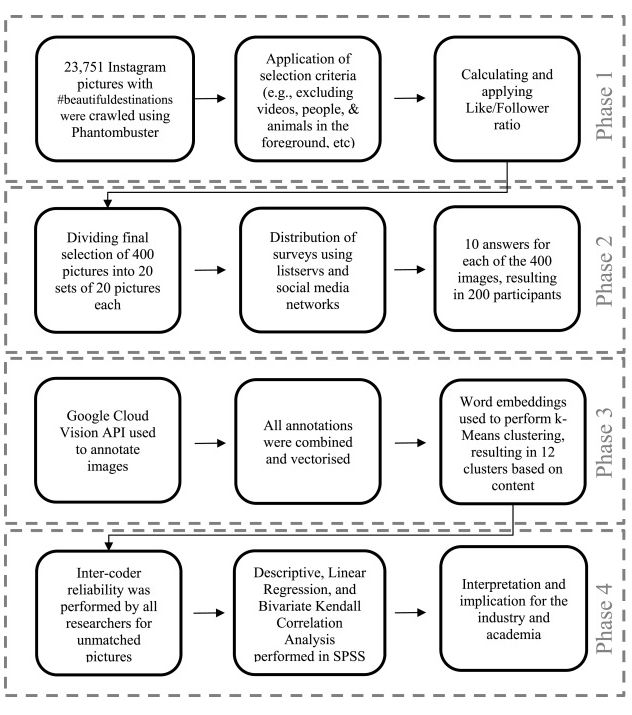
In my research seminar “eTourism Research” at our study program “Innovation and Management in Tourism” at the Salzburg University of Applied Sciences I always manage to write a publishable paper with a group. Together with my students Diana Hauser, Antonia Leopold, Hasini Ganewita, and Leonie Herrgesell we published the paper “Aesthetic perception analysis of destination pictures using #beautifuldestinations on Instagram” in the “Journal of Destination Marketing & Management”.
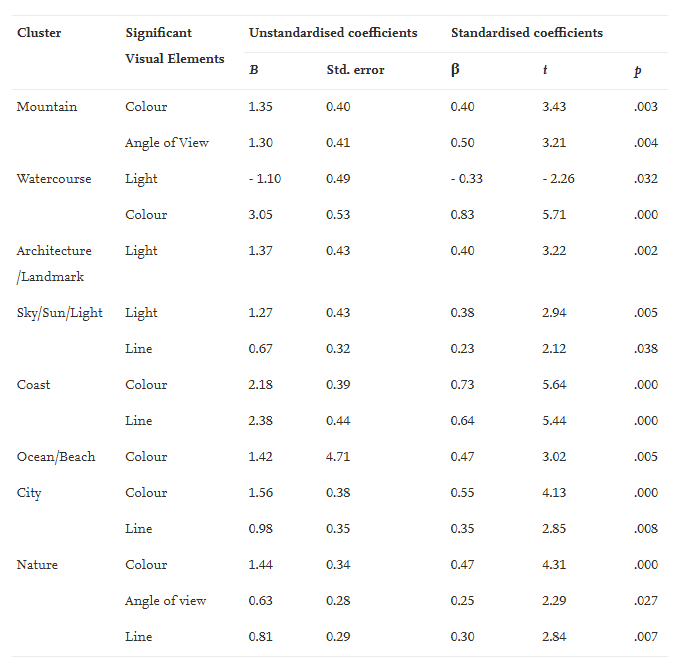
In this article are focusing on the perception of aesthetics of destination pictures using machine learning to cluster photos from Instagram with the hashtag “beautifuldestination” according to their themes (Mountain, Architecture, Coast, City, Nature, Bird-Eye View etc.) and then analyzed them with regard to the relevance of design elements such as color, light, line, angle of view and focus. We used machine learning to cluster photos from Instagram with the hashtag “beautifuldestination” according to their themes (Mountain, Architecture, Coast, City, Nature, Bird-Eye View etc.) and then analyzed them with regard to the relevance of design elements such as color, light, line, angle of view and focus.
The results clearly show that different design elements are relevant to the perception of aesthetics for different topics.
The Bidirectional Encoder Representations from Transformers (BERT) is currently the most important and state-of-the-art natural language model (Tenney et al., 2019) since its launch in 2018 by Google. BERT Large, which is based on a Transformer architecture, is considered one of the most powerful language models with 24 layers, 16 attention heads, and 340 million parameters (Lan et al. 2019). BERT is a pretrained model and can be fine-tuned to perform numerous downstream tasks such as text classification, question answering, sentiment analysis, extractive summarization, named entity recognition, or sentence similarity (Egger, 2022). The model was pretrained on a huge English corpus in a self-supervised way. Raw texts from a BookCorpus of over 11,000 books and English Wikipedia were used to generate this state-of-the-art model. From this, it can already be concluded that BERT was trained on a huge generic corpus (Edwards et al., 2020) . However, it has been shown in the past that for domain-specific applications and downstream tasks, it is helpful to pretrain BERT on a large domain-specific corpus to enable it to learn the linguistic peculiarities better (Gururangan et al., 2020). For example, BERT variants have been pretrained for the financial sector (FinBERT) (Araci, 2019), the medical sector (Clinical BERT) (Alsentzer et al., 2019), for biomedical texts (BioBERT) (Lee et al., 2020), or SciBERT (Beltagy and Cohan, 2019) for biomedical and computer science.
Tourism is one of the most important economic sectors in the world (Hollenhorst et al., 2014), and its services have many characteristics that distinguish them from other products. Services are not tangible and cannot be tested in advance, which is why the customer assumes an increased risk before starting the trip. The service is co-created together with the customer, so the customer is an active co-creator of the service. Services are subject to the uno-actu principle, which means they are produced at the same time as they are consumed, and they are considered bilateral, i.e. a reciprocal relationship between persons (Chehimi, 2014). In addition, tourism services are relatively expensive compared to everyday products and have an intercultural dimension. All this means that tourism services are extremely description-intensive (Dooolin et al., 2002). In addition to detailed descriptions by the supply side, user-generated content is becoming increasingly important (Yu and Egger, 2021). Whether on review platforms such as TripAdvisor or social media channels such as Twitter, Facebook or Instagram, people everywhere are sharing their travel experiences, thus influencing other users (Daxböck et al, 2021). This content is of particular importance for tourism providers, as they are losing control over UGC (Saraiva, 2013).
The automated analysis of texts using natural language processing methods is therefore becoming increasingly important for both academia and the tourism industry (Egger and Gokce, 2022).
In order to meet the requirements of tourism, we introduce TourBERT in this paper. It was pretrained on 3.6 million tourist reviews and about 50k descriptions of tourist services and attractions and sights from more than 20 different countries around the world. The intercultural context, in particular, leads to linguistic peculiarities that BERT as a general language model cannot cope with. In the following, we introduce TourBERT and describe how it was trained and evaluated.
We, therefore, pretrained TourBERT from scratch with 1million steps using BERT-Base architecture with WordPiece tokenizer and our crawled, tourism-specific vocabulary with the same vocabulary size as BERT-Base. For the pretraining procedure, we followed official BERT repo recommendations.
Technical description
TourBERT has BERT-Base-uncased as an underlying architecture and was trained from scratch. So no initial checkpoints were used like it was done for BioBERT or FinBERT. The whole corpus was pre-processed by lowercasing the data, splitting them into sentences using punctuation as separators. A custom WordPice tokenizer was trained to create a custom input for the TourBERT model using 30.522 tokens in total which is the same number as BERT-Base has.
The pretraining was performed for 1M steps on a single TPU instance provided by Google Colab Pro which took about three days in total.
TourBERT Model evaluation
In order to evaluate TourBERT, both quantitative and qualitative measurements were applied. A supervised task, namely sentiment classification, was used for the quantitative evaluation.
Evaluation Task 1: Sentiment Classification
To perform classification using BERT a number of different options are available. First, a softmax layer on top of the BERT architecture could be used, which is one of the most widely used approaches. Second, an LSTM neural network can be used as a separate classification model. This approach is useful if an input example cannot be represented as a single vector, i.e. the length of an input text is significantly greater than the maximum input length allowed by the BERT-model. In our case, we decided, however, to use a single feed-forward layer on top of the BERT architecture, as this is a simple way to construct a classifier, and this approach is widely used to benchmark different BERT models against each other. After a single feed-forward layer is attached on top of the BERT architecture, all layers of the BERT model itself are frozen, i.e. only the classifier is trained.
The authors are aware that this does not usually yield state-of-the-art results, but the goal of this evaluation was not to achieve the highest score on a given dataset but to show that the quality of TourBERT embeddings surpasses the BERT-Base model.
This dataset has three Labels: {-1: “negative”, 0:”neutral”, 1: “positive”} and a total of 69.308 reviews.
The second dataset is the “515k reviews from Europe hotels” dataset available at https://www.kaggle.com/jiashenliu/515k-hotel-reviews-data-in-europe; we used only reviews which have either negative or positive labels and thus turned this problem into a binary classification with the two following labels:
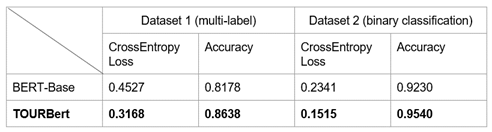
{-1: “negative”, 1: “positive”}. We sampled 35.000 positive and 35.000 negative reviews resulting in 70.000 samples in total. Table 1 shows the evaluation results for both datasets and that TourBERT outperforms BERT-Base in that tasks.
Table 1. Results of supervised evaluation for TourBERT and BERT-Base on two sentiment classification datasets.
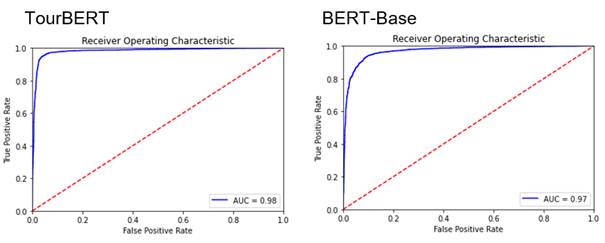
Figure 1. The Area under ROC-Curve (AUC) scores for TourBERT and BERT-Base
For the qualitative evaluation, unsupervised tasks and a user study was performed. On the one hand, a topic modeling task, synonyms search, and a within-vocabulary words similarity distribution task were designed.
Evaluation Task 2: Unsupervised Evaluation / Visualization of Photos
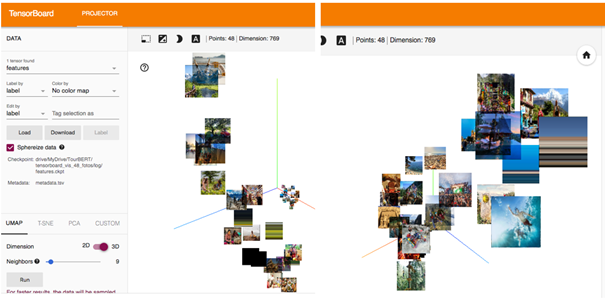
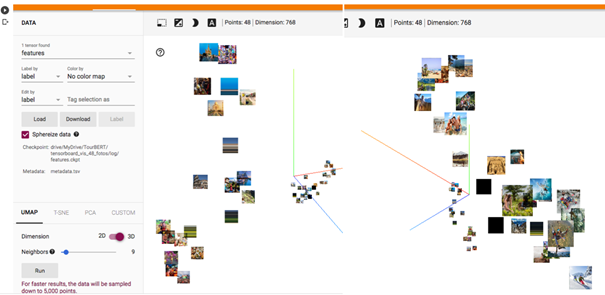
The first unsupervised evaluation was the visualization of photos in the Tensorboard Projector. Therefore a dataset of 48 photos showing different tourism activities like sports activities, visiting sights, shopping, and others were used. Next, a sample of 622 people was engaged to perform manual labeling of these photos by assigning two bi-gram tags to each foto. These annotations were then visualized using the TensorBoard projector API, which allows visualizing original photos on a 2D- or a 3D-plot centered at their respective cluster centers. Finally, the evaluation was done after performing UMAP by inspecting and comparing the group’s separation quality on the plot.
Figure 2. BERT-Base / TensorBoard Projector
Figure 3. TourBERT / TensorBoard Projector
The purpose of such a visualization is to evaluate the separation of clusters which naturally result from the down-projection method. We can see that TourBERT vectors result in better separated groups and pictures within the same group have similar contents. By looking at the results produced using BERT-Base vectors, it can be observed that photos are heavily mixed and do not allow to identify well-separated groups.
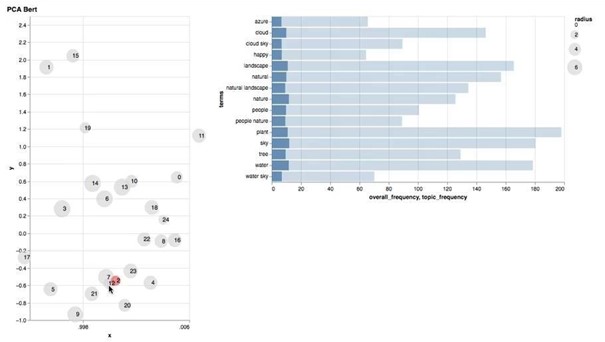
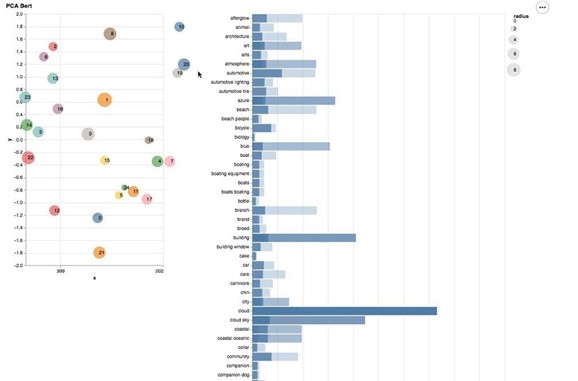
A subsequent and unsupervised evaluation was done by applying a topic modeling approach. For this, 5000 Instagram posts from public accounts with the hashtag #wanderlust were crawled using the Python ScraPy library. Instagram is based on photos which are the primary source of information, while the textual description of Instagram posts is often either limited to hashtags, emojis and unrelated to the photo or completely missing. Therefore images were annotated using Google Cloud Vision API, and a TouBERT vector was generated for each photo annotation. Then a K-means clustering approach was used to group the annotation vectors. K was chosen using the silhouette score, which resulted in 25 clusters. Then a PCA down-projection method was used to visualize the points on a plot which allowed us to determine how distinct topic words are and whether they overlap. This approach did not aim to develop a new topic modeling approach as there are embedding-based approaches with a similar logic available like Top2Vec (Angelov, 2020) or BERTopic (Grootendorst, 2020), but only to compare the performance of BERT-Base vs. TourBERT. For the evaluation, an interactive visualization board using Python’s Sklearn and Altair libraries was developed, similar to pyLDAVis for LDA topic modeling, containing two blocks. The block on the lift visualizes cluster centers on a 2D plot, where the size of a cluster center is proportional to the cluster population size. Each point is clickable and defines the output on the second block on the right. This is a horizontal bar chart, visualizing the top 15 most frequent words for a topic. The darker bars represent the word distribution within the entire dataset. The lighter bars show the word distribution within the selected topic. Evaluation can now be done on two aspects: the goodness of the topic separation (i.e. cluster centers do not overlap and are placed far away from each other) and how similar are words within the same cluster.
Figure 4. Topic Modeling – Results for BERT-Base
Figure 5. Topic Modeling – Results for TourBERT
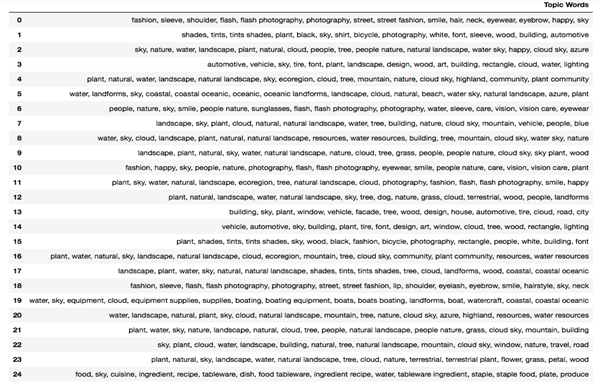
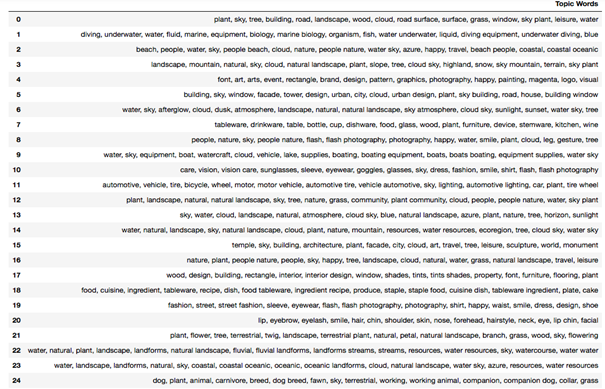
From figures 4 and 5, we can see that cluster centers produced using down-projected TourBERT vectors are clearly better separated compared to those produced with BERT-Base ones. Some of the topic words can be seen in tables 2 and 3 for BERT-Base and TourBERT, respectively:
Table 2. Topic words for 25 topics produced with BERT-Base vectors.
Table 3. Topic words for 25 topics produced with TourBERT vectors.
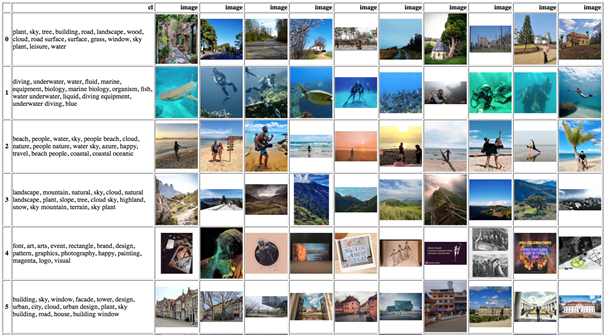
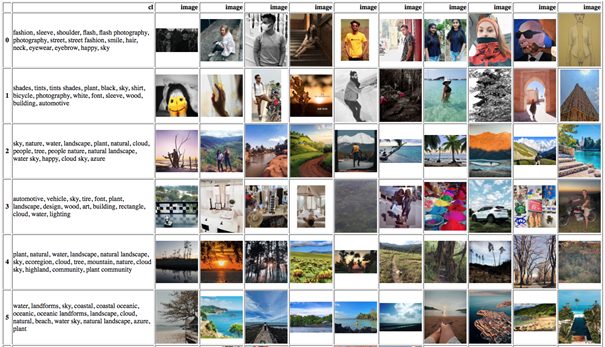
To have a better understanding of the topics’ quality, we output the top-10 nearest samples for each cluster and look at the photos for which the samples were produced for like shown in figures 6 and 7 below. Each figure contains a table with the first column showing words for a given topic and all subsequent columns showing top-10 most similar samples, i.e. photos for that topic.
Figure 6. The first six topics with cluster words and top-10 most similar images, produced by the K-Means model using TourBERT vectors.
Figure 7. The first six topics with cluster words and top-10 most similar images, produced by the K-Means model using BERT-Base vectors.
Comparing both models’ results, we can see that clusters achieved with TourBERT vectors are much more homogenous within the clusters and heterogenous between the clusters compared to those for BERT-Base, which sometimes include relatively dissimilar photos belonging to the same topic, like in topic 3.
To further investigate the quality of each topic produced by the model and prove our assumptions, we conducted a user study to statistically evaluate the results, which is described in detail in the next section.
Evaluation Task 4: Unsupervised Evaluation / User Study
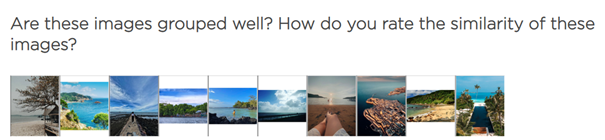
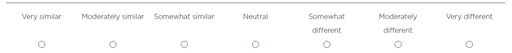
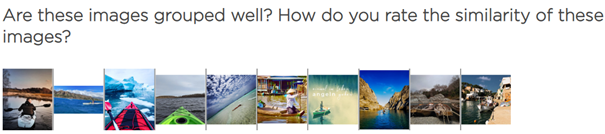
For the same dataset of images and annotations, a user study was designed. Therefore a set of the 10 most similar photos for each of the 25 clusters of BERT-Base and TourBERT was created, and users were asked to evaluate how similar the photos within each of the 50 clusters are on a 7-point Likert scale with possible answers ranging from “very similar” to “very different”. This evaluation approach allows for getting an intersubjective perception of the cluster qualities, similar to measuring the intercoder reliability in qualitative studies. The image clusters were shown to the participants in a rotating manner, i.e. randomly alternating.
Figure 6. Two examples of image clusters
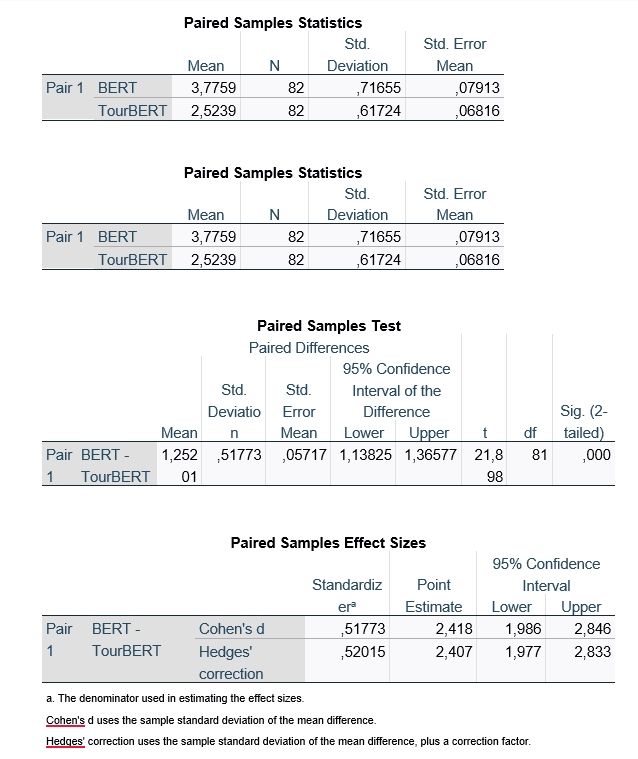
For the evaluation of study results, a pairwise t-test was performed with SPSS. The coding ranged from [1 – very similar] to [7 – very different], and the mean values were 3,75 and 2,5 for BERT-Base and TourBERT respectively at a highly significant level (Sig. two-sided ,000). The effect size was measured with Cohen´s d and yielded with 0,517 a medium level effect.
Table 4. Results of the paired samples mean comparison
These results show that the similarity of the annotated images was perceived significantly better with TourBERT than with BERT-Base.
Evaluation Task 5: Synonyms Search
According to the assumption that BERT-Base, due to its general trained corpus, achieves more generic results than the TourBERT model trained on a tourism-specific corpus, it was assumed that a similarity search of tourism-related terms would turn out better with TourBERT than with BERT-Base. For similarity search, we choose words displayed in the first row of the table, which are: “authenticity”, “experience”, “entrance”, and so on. We output the top-8 most similar words for each word, which can be seen in the tables below.
Figure 7. Synonyms Search with BERT-Base
Figure 8. Synonyms Search with TourBERT
When comparing synonyms produced by BERT-Base and TourBERT, one can see that TourBERT almost perfectly captures a tourism-specific meaning of the word. On the contrary, BERT-Base captures a more generic meaning of the same words. For example, TourBERT associates the word “destination” with words like “spot” and “attraction” and place, whereas BERT-Base considers the same word “destination” to be similar with terms like “dying”, “choice”, and “lame”.
Summary and model usage
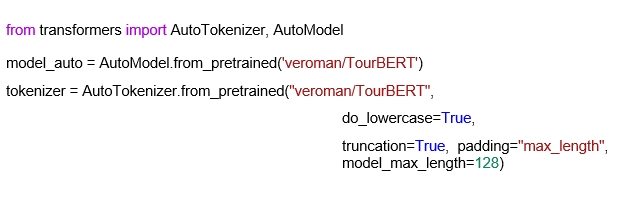
All evaluation tasks have proven the performance of TourBERT for use in the tourism-specific context. TourBERT outperforms BERT-Base in all tasks and thus represents a suitable language model for both academia and the tourism industry. The Tensorflow checkpoint of TourBERT has been converted to the PyTorch binary format and is released on Hugging Face Hub at the following URL: https://huggingface.co/veroman/TourBERT. One can simply load the TourBERT model and the tokenizer using the following three lines of code:
TourBERT Release V1: 16.01.2022
References:
Alsentzer, E., Murphy, J. R., Boag, W., Weng, W. H., Jin, D., Naumann, T., & McDermott, M. (2019). Publicly available clinical BERT embeddings. arXiv preprint arXiv:1904.03323 .
Angelov, D. (2020). Top2vec: Distributed representations of topics. arXiv preprint arXiv:2008.09470.
Araci, D. (2019). Finbert: Financial sentiment analysis with pre-trained language models. arXiv preprint arXiv:1908.10063.
Beltagy, I., Lo, K., & Cohan, A. (2019). Scibert: A pretrained language model for scientific text. arXiv preprint arXiv:1903.10676.
Chehimi, N. (2014). Tourist Information Search. In The Social Web in the Hotel Industry (pp. 49-70). Springer Gabler, Wiesbaden.
Daxböck, J., Dulbecco, M. L., Kursite, S., Nilsen, T. K., Rus, A. D., Yu, J., & Egger, R. (2021). The Implicit and Explicit Motivations of Tourist Behaviour in Sharing Travel Photographs on Instagram: A Path and Cluster Analysis. In Information and Communication Technologies in Tourism 2021 (pp. 244-255). Springer, Cham.
Doolin, B., Burgess, L., & Cooper, J. (2002). Evaluating the use of the Web for tourism marketing: a case study from New Zealand. Tourism management, 23(5), 557-561.
Edwards, A., Camacho-Collados, J., De Ribaupierre, H., & Preece, A. (2020, December). Go simple and pre-train on domain-specific corpora: On the role of training data for text classification. In Proceedings of the 28th International Conference on Computational Linguistics (pp. 5522-5529).
Egger, R. (2022) Text Representations and Word Embeddings. Vectorizing Textual Data. In: Egger, R. (Ed.) Applied Data Science in Tourism. Interdisciplinary Aprochaches, Methodologies and Applicaitions. Springer (forthcoming).
Egger, R. and Gokce, E. (2022) Natural Language Processing: An Introduction. In: Egger, R. (Ed.) Applied Data Science in Tourism. Interdisciplinary Aprochaches, Methodologies and Applicaitions. Springer (forthcoming).
Gururangan, S., Marasović, A., Swayamdipta, S., Lo, K., Beltagy, I., Downey, D., & Smith, N. A. (2020). Don’t stop pretraining: adapt language models to domains and tasks. arXiv preprint arXiv:2004.10964.
Hollenhorst, S. J., Houge-Mackenzie, S., & Ostergren, D. M. (2014). The trouble with tourism. Tourism Recreation Research, 39(3), 305-319.
Lan, Z., Chen, M., Goodman, S., Gimpel, K., Sharma, P., & Soricut, R. (2019). Albert: A lite bert for self-supervised learning of language representations. arXiv preprint arXiv:1909.11942.
Lee, J., Yoon, W., Kim, S., Kim, D., Kim, S., So, C. H., & Kang, J. (2020). BioBERT: a pre-trained biomedical language representation model for biomedical text mining. Bioinformatics, 36(4), 1234-1240.
Saraiva, J. P. D. P. M. (2013). Web 2.0 in restaurants: insights regarding TripAdvisor’s use in Lisbon (Doctoral dissertation).
Tenney, Ian, Dipanjan Das, and Ellie Pavlick. “BERT rediscovers the classical NLP pipeline.” arXiv preprint arXiv:1905.05950 (2019).
Yu, J., & Egger, R. (2021). Tourist Experiences at Overcrowded Attractions: A Text Analytics Approach. In Information and Communication Technologies in Tourism 2021 (pp. 231-243). Springer, Cham.
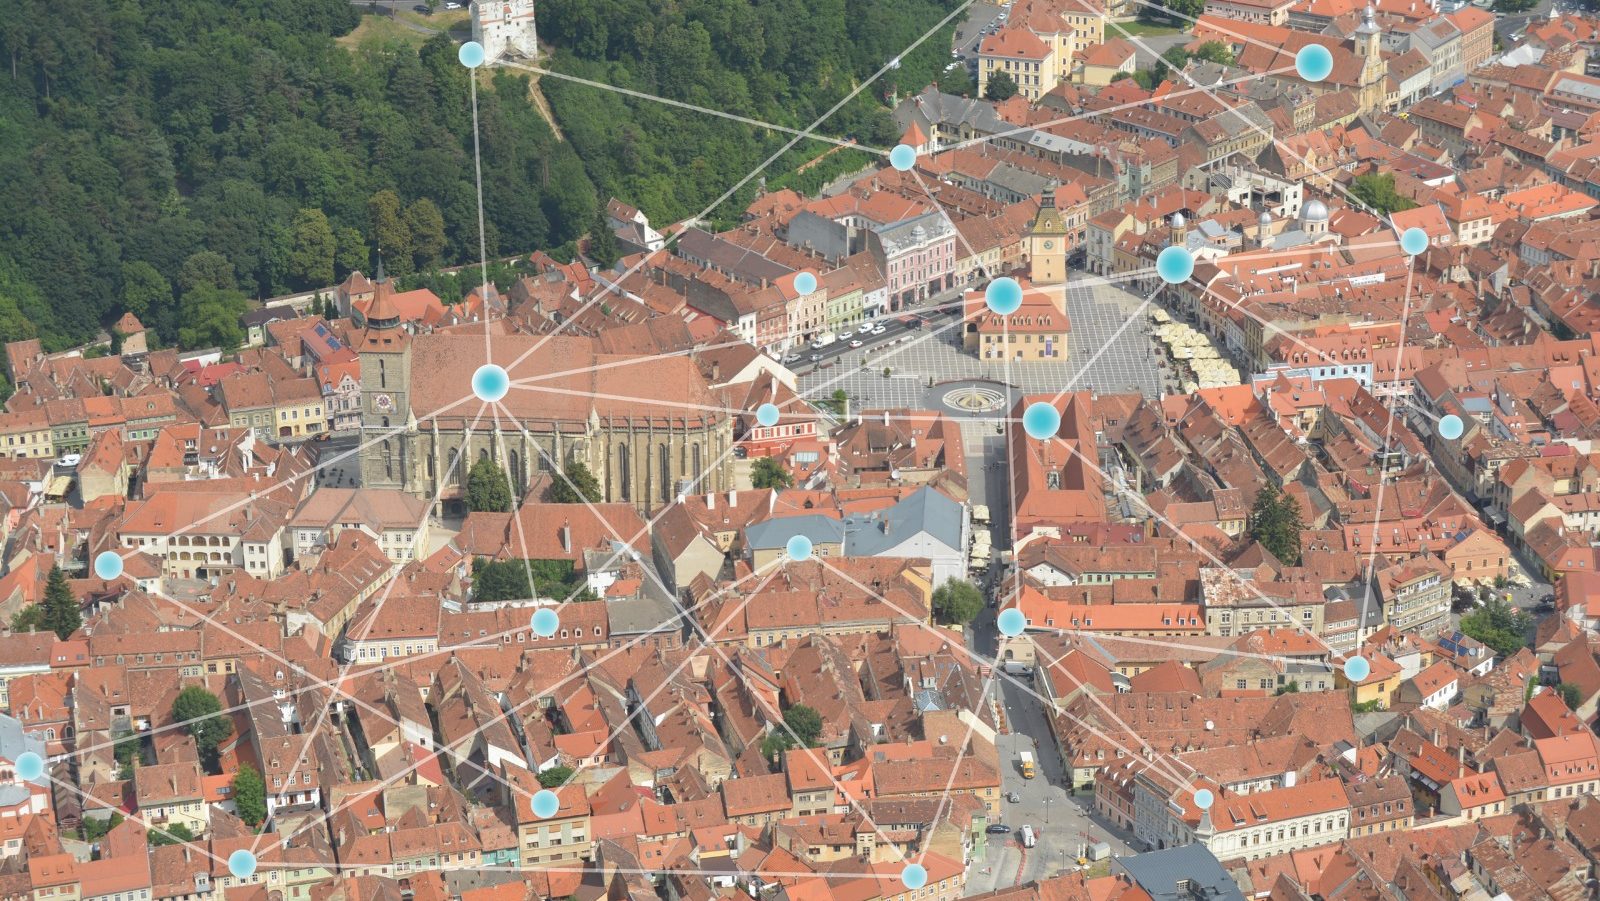
Tourism, as a system, is dependent on collaboration between stakeholders, in order to ensure the development of a destination as a whole and also benefit for each individual stakeholder. This fact triggered a growing interest in understanding tourism collaboration, which has led to a considerable diversification of conceptual and methodological approaches. One emerging and promising area of inquiry consist in approaching tourism collaboration from the perspective of multilayer networks (Baggio, 2017), a concept also known as “network of networks” in network science (Kivela et al., 2014).
However, very few papers have inquired the structure of tourism collaboration networks from a multilayer perspective and none of them systematically inquired about both structural variations from one collaboration layer to another and interdependencies that might exist between collaboration layers. The current research has aimed precisely at filling this gap by methodologically combining Social Network Analysis (SNA) with nonparametric statistical analysis, and by taking as case studies two Romanian destinations: an emerging one (Bran), and a stagnating one (Vatra Dornei).
Methodological approach and results
Data used in this paper has been collected through semi-structured interviews with 47 stakeholders from the two destinations. The focus of the interviews was on identifying all relationships of each interviewed stakeholder, along with important information related to the collaborator and the purpose of collaboration. The analysis has been conducted in two steps, with two corresponding sets of results.
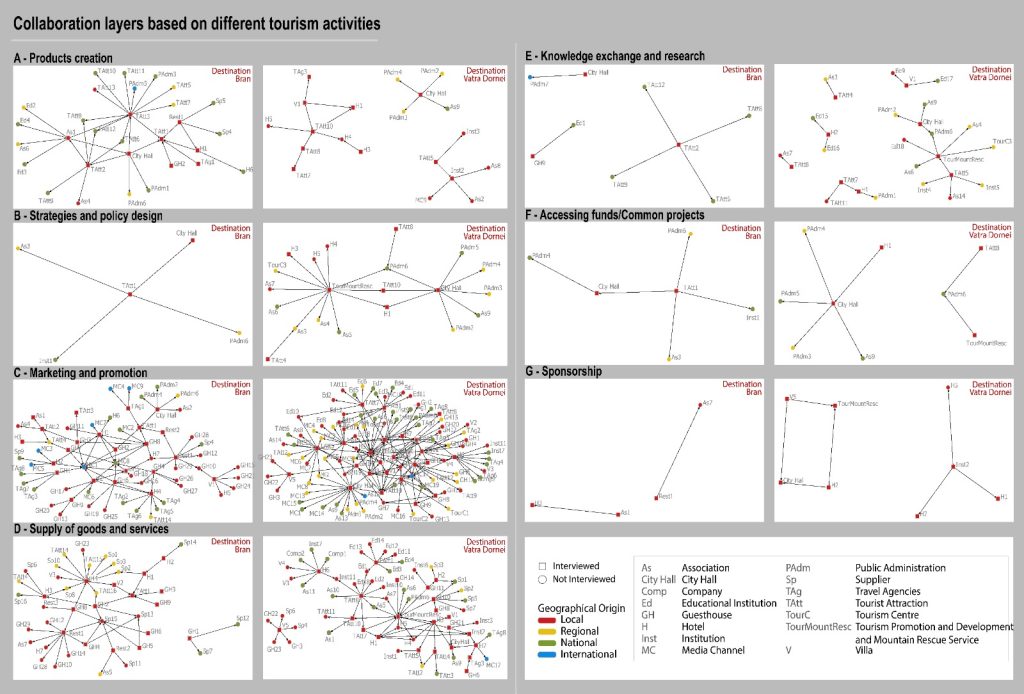
First, SNA allowed for a thorough investigation of each sub-network identified based on 7 different purposes of collaboration. For this, the sociogram for each sub-network was created and several metrics were calculated. Important differences between the layers were identified in this stage: largest and densest sub-networks are those for marketing and for the supply of goods and services while accessing funds or sponsorships barely create network structures.
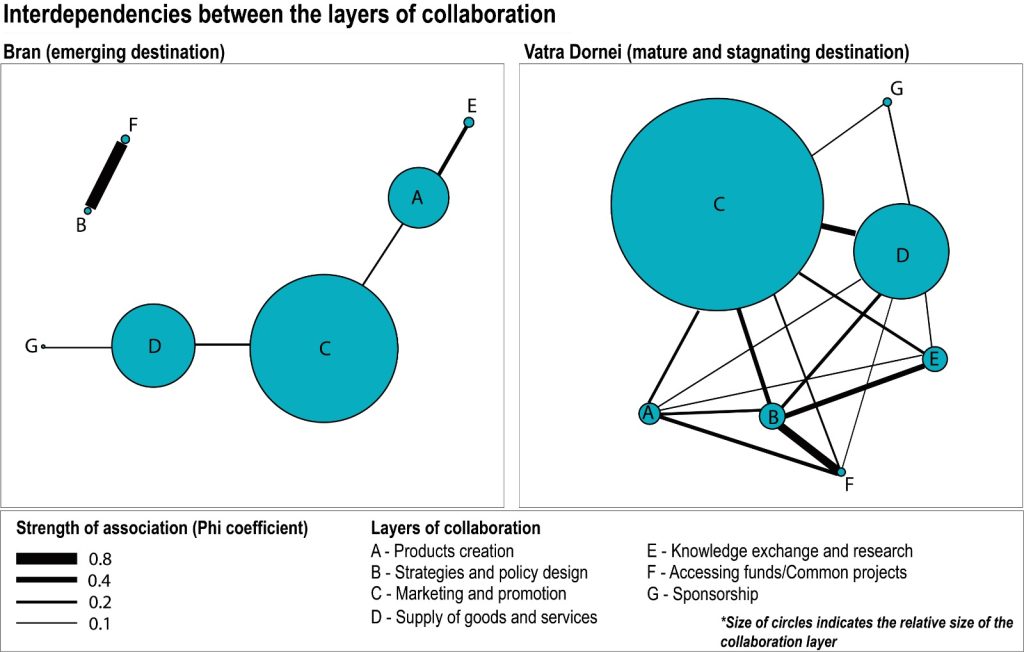
Second, the associations between the 7 sub-networks in each destination have been identified through multiple correspondence analyses. The most important result is that some interdependencies between layers of collaboration are common for both destinations, despite one being an emergent destination and the other a stagnating one. More precisely, results suggest significant interdependencies between the following pairs of activities: (1) policy design and accessing funds and (2) products creation and knowledge exchange and research.
Originality
This paper contributes to the literature by operationalizing the concept of multilayer networks in tourism studies and by delivering one of the first systematic analyses in tourism of interdependencies between different layers of collaboration. It also draws attention to the potential that the multilayer network approach has for providing important knowledge on stakeholders’ collaboration and calls for more analyses from such a perspective.
References
Baggio, R. (2017). Network science and tourism – the state of the art. Tourism Review, 72(1), 120-131.
Kivela, M., Arenas, A., Barthelemy, M., Gleeson, J.P., Moreno, Y., & Porter, M.A. (2014). Multilayer networks. Journal of Complex Networks, 2, 203-271.
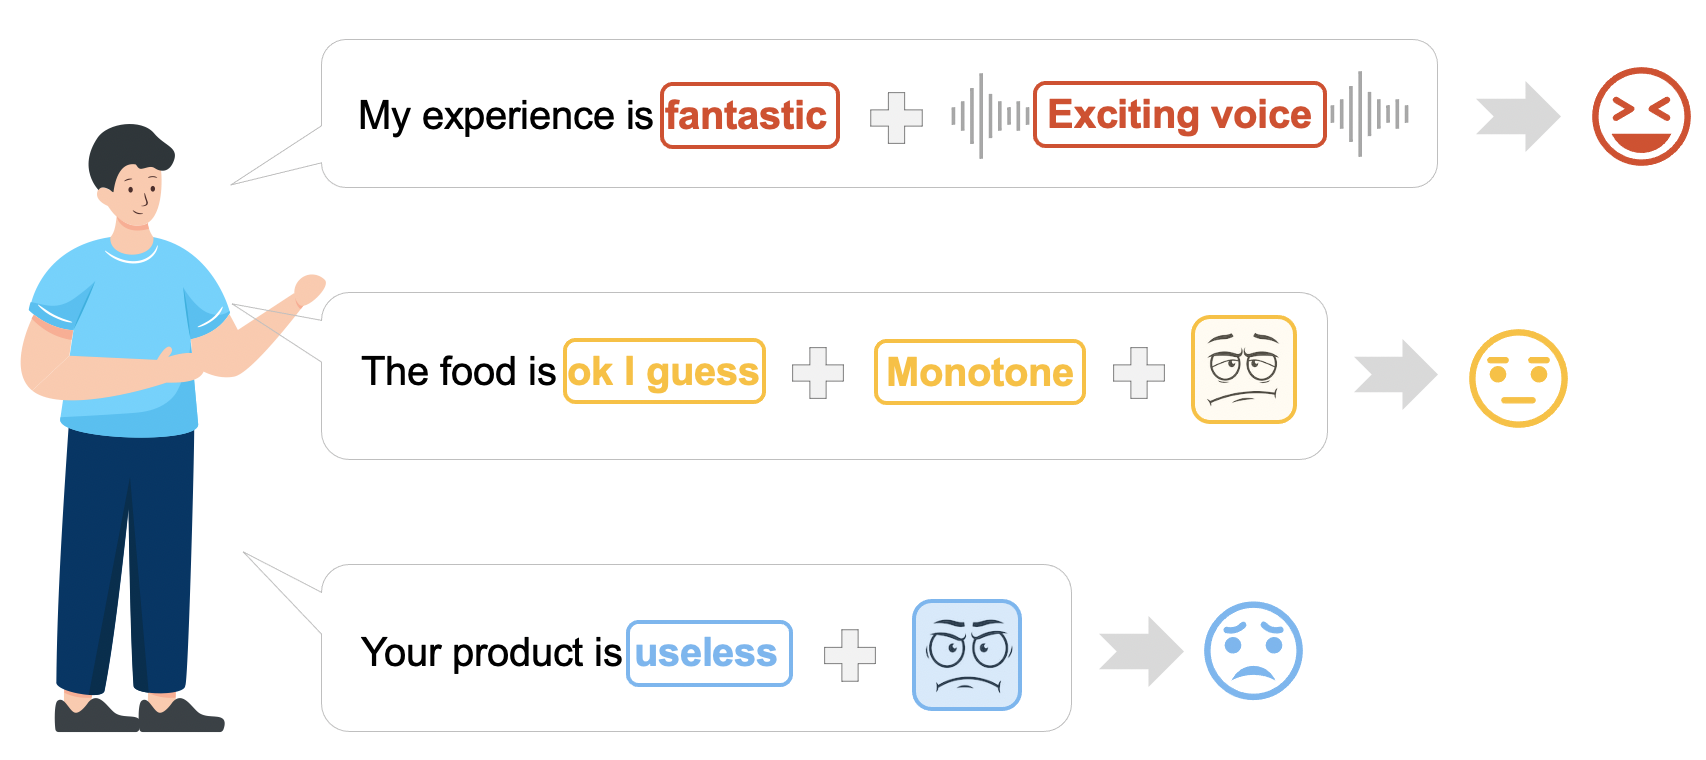
Multimodal sentiment analysis aims to recognize people’s attitudes from multiple communication channels such as verbal content (i.e., text), voice, and facial expressions. It has become a vibrant and important research topic in natural language processing, which also benefits various applications, such as social robots, customer analysis, healthcare, and tourism applications.
An example of expressing opinions through multimodal communication channels
What is M2Lens?
Currently, deep-learning-based models achieve superior performance over the traditional methods in multimodal sentiment analysis. Representative examples include transformers, CNNs, and RNNs. However, these models often work like black-boxes, hindering users from understanding the underlying model mechanism and fully trusting them in decision-makings. Post-hoc explainability techniques, such as LIME, SHAP, and IG, help identify important features (e.g., words or image patches) that influence model predictions. However, these methods often target providing local explanations on instances (e.g., sentences) in unimodal scenarios. They do not scale well to produce global explanations on how intra- and inter-modal in- teractions influence the model decisions, for example, how the models will behave when positive words and sad voices are presented.
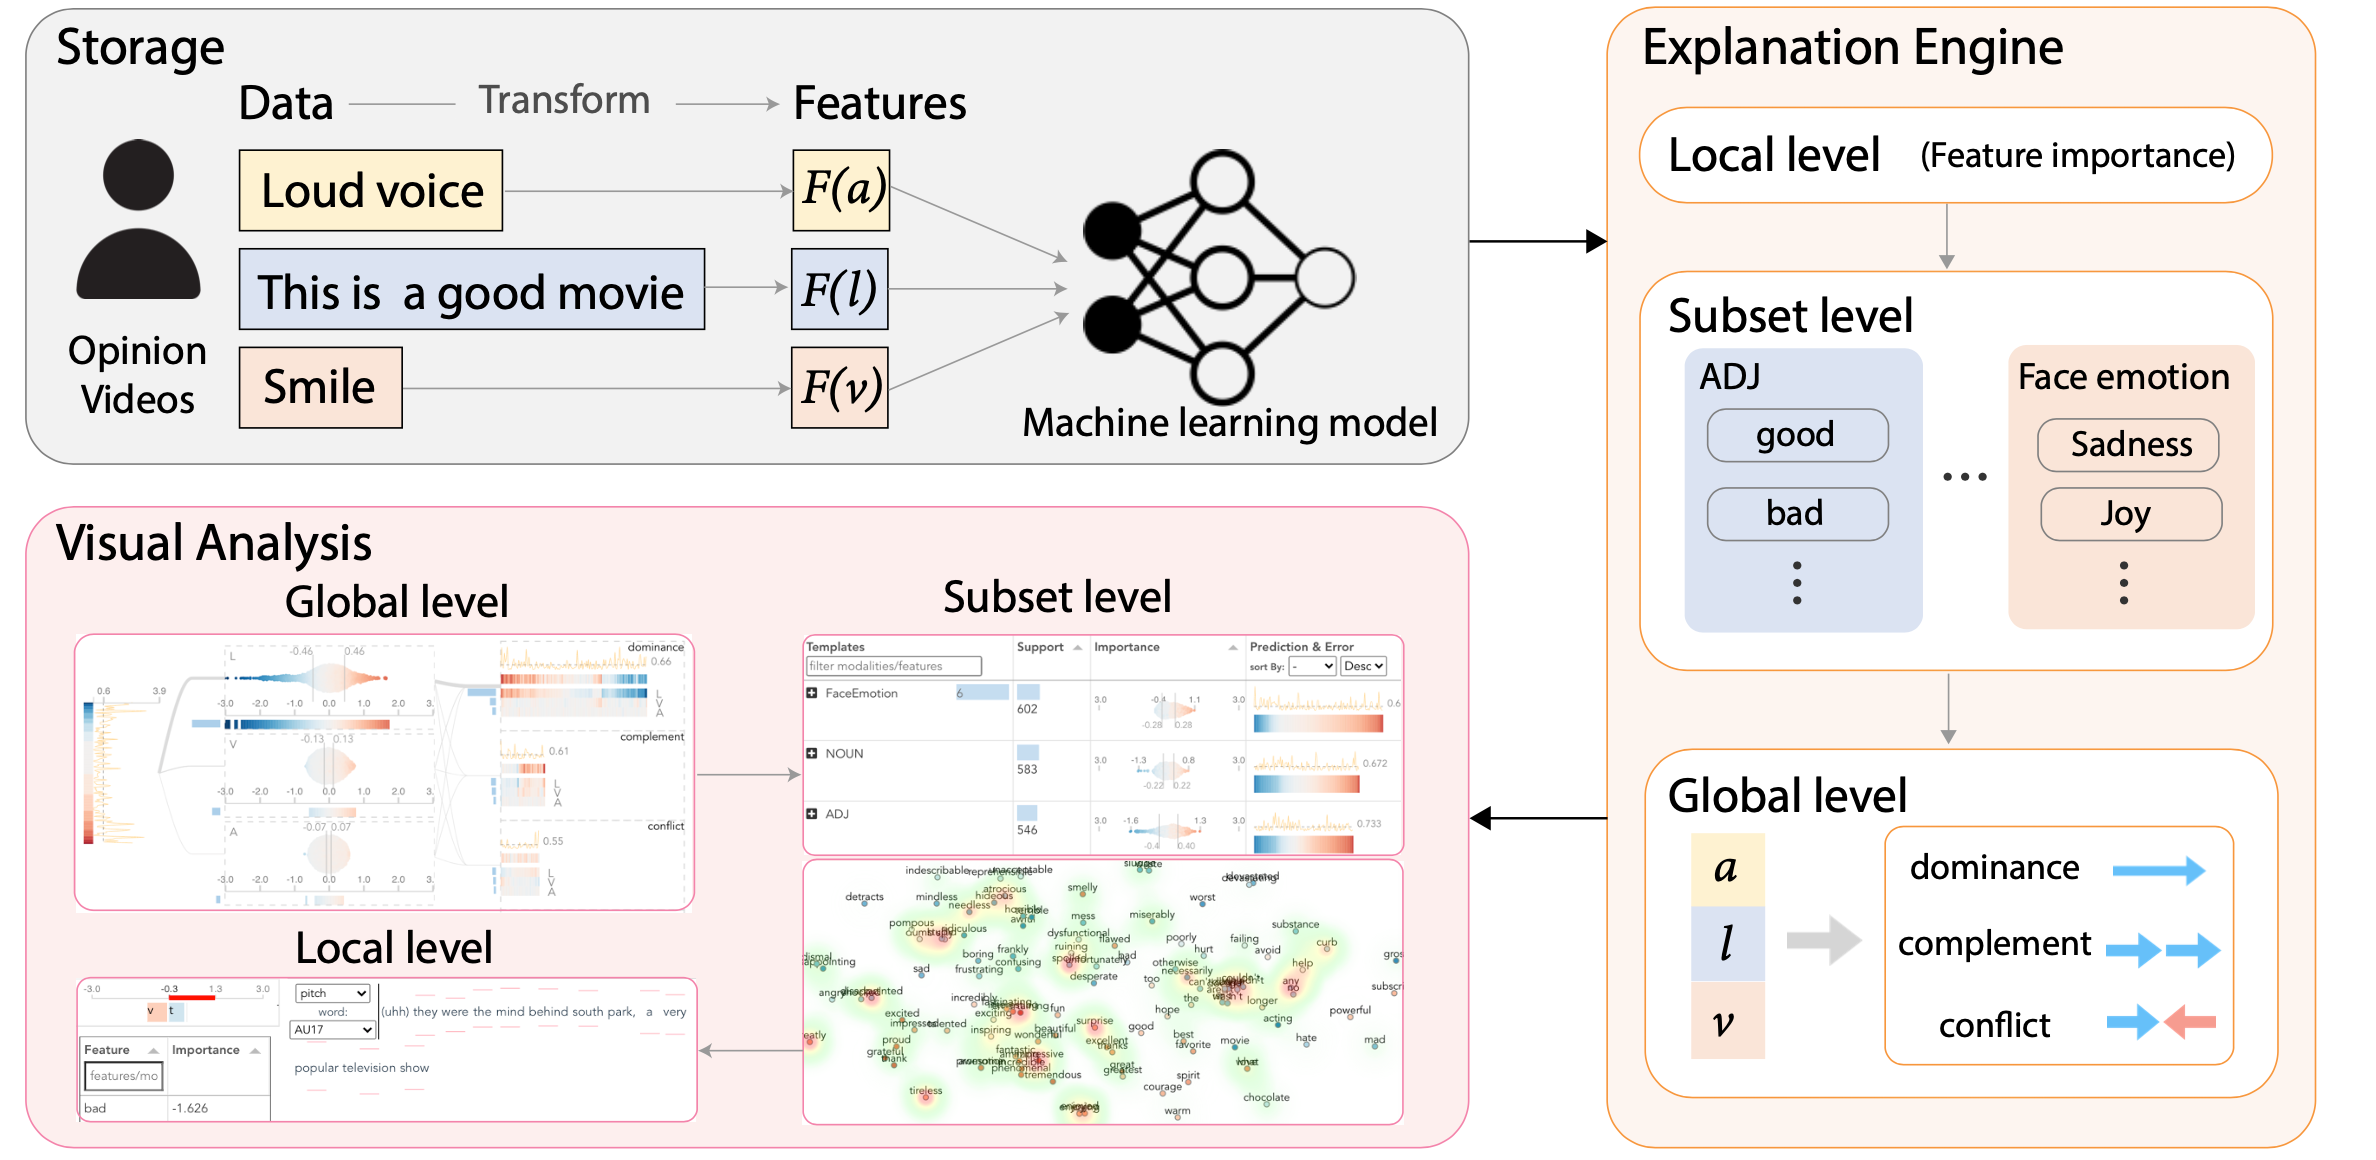
We present M2Lens, a novel explanatory visual analytics tool to help both developers and users of multimodal machine learning models better understand and diagnose Multimodal Models for sentiment analysis.
It consists of a storage module, an explanation engine, and a visual analysis interface
How does it work?
Multi-modal sentiment analysis combines the heterogeneous data and captures two primary forms of interactions in different modalities: Intra-modal interactions refer to the dynamics of one modality. Inter-modal interactions consider the correspondence between different modalities across time.
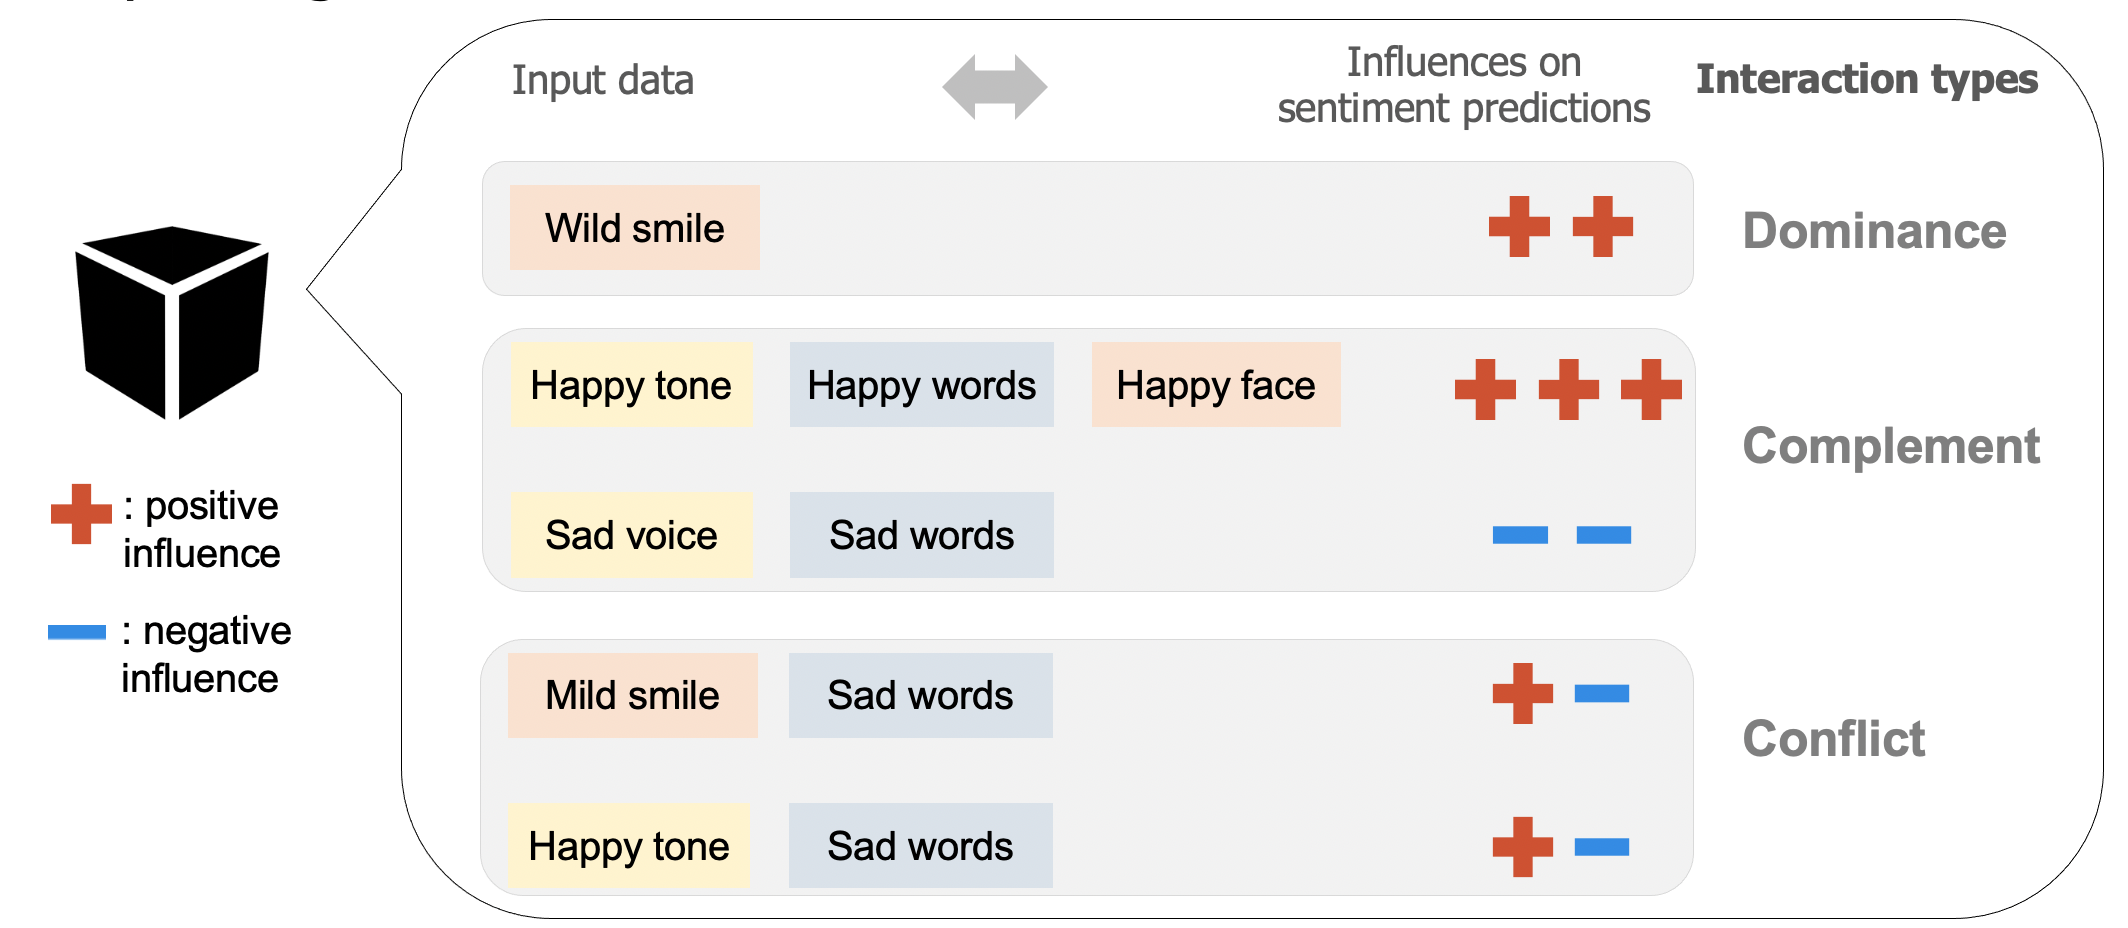
We formulate a set of rules to characterize three typical types of interactions among modalities, including dominance, complement, and conflict. The dominance suggests that the influence of one modality dominates the polarity (i.e., positive sentiment or negative sentiment) of a prediction. The complement indicates that two or all three modalities affect a model prediction in the same direction. The conflict reveals that the influences of modalities differ from each other.
Three typical types of interactions among modalities
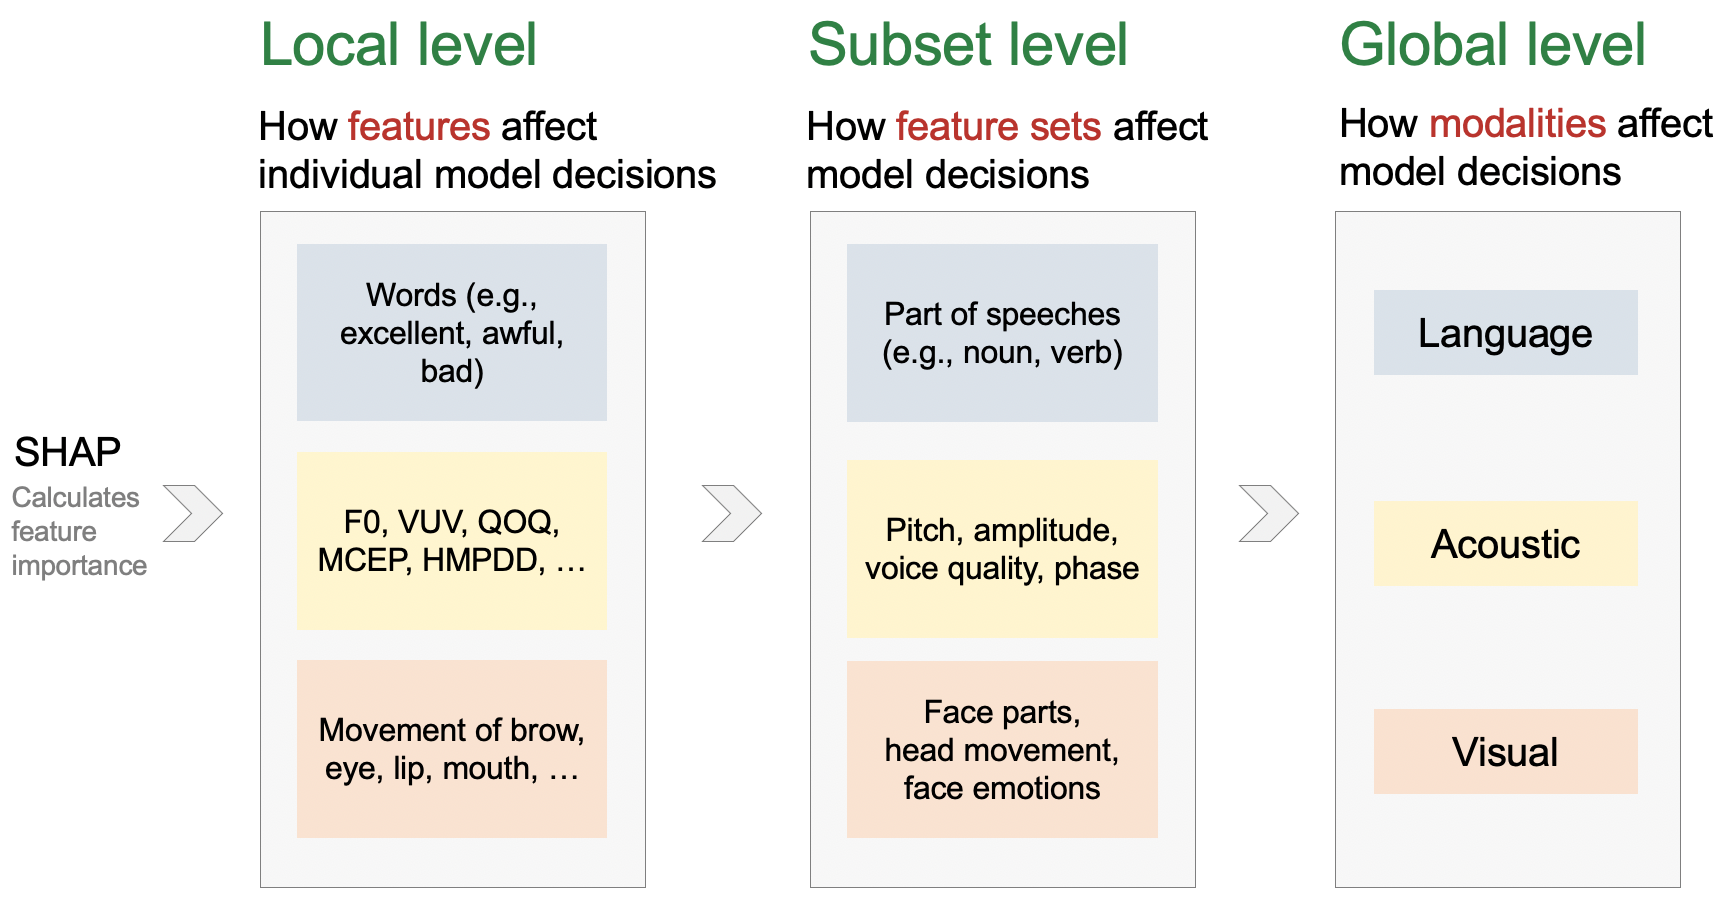
To facilitate a comprehensive understanding of multimodal models, M2Lens offered multi-level and multi-faceted explanations, including the influences of individual modalities and their interplay, and importance of multimodal features.
Multi-level & Multi-faceted explanations
Case Study: Multimodal Transformer
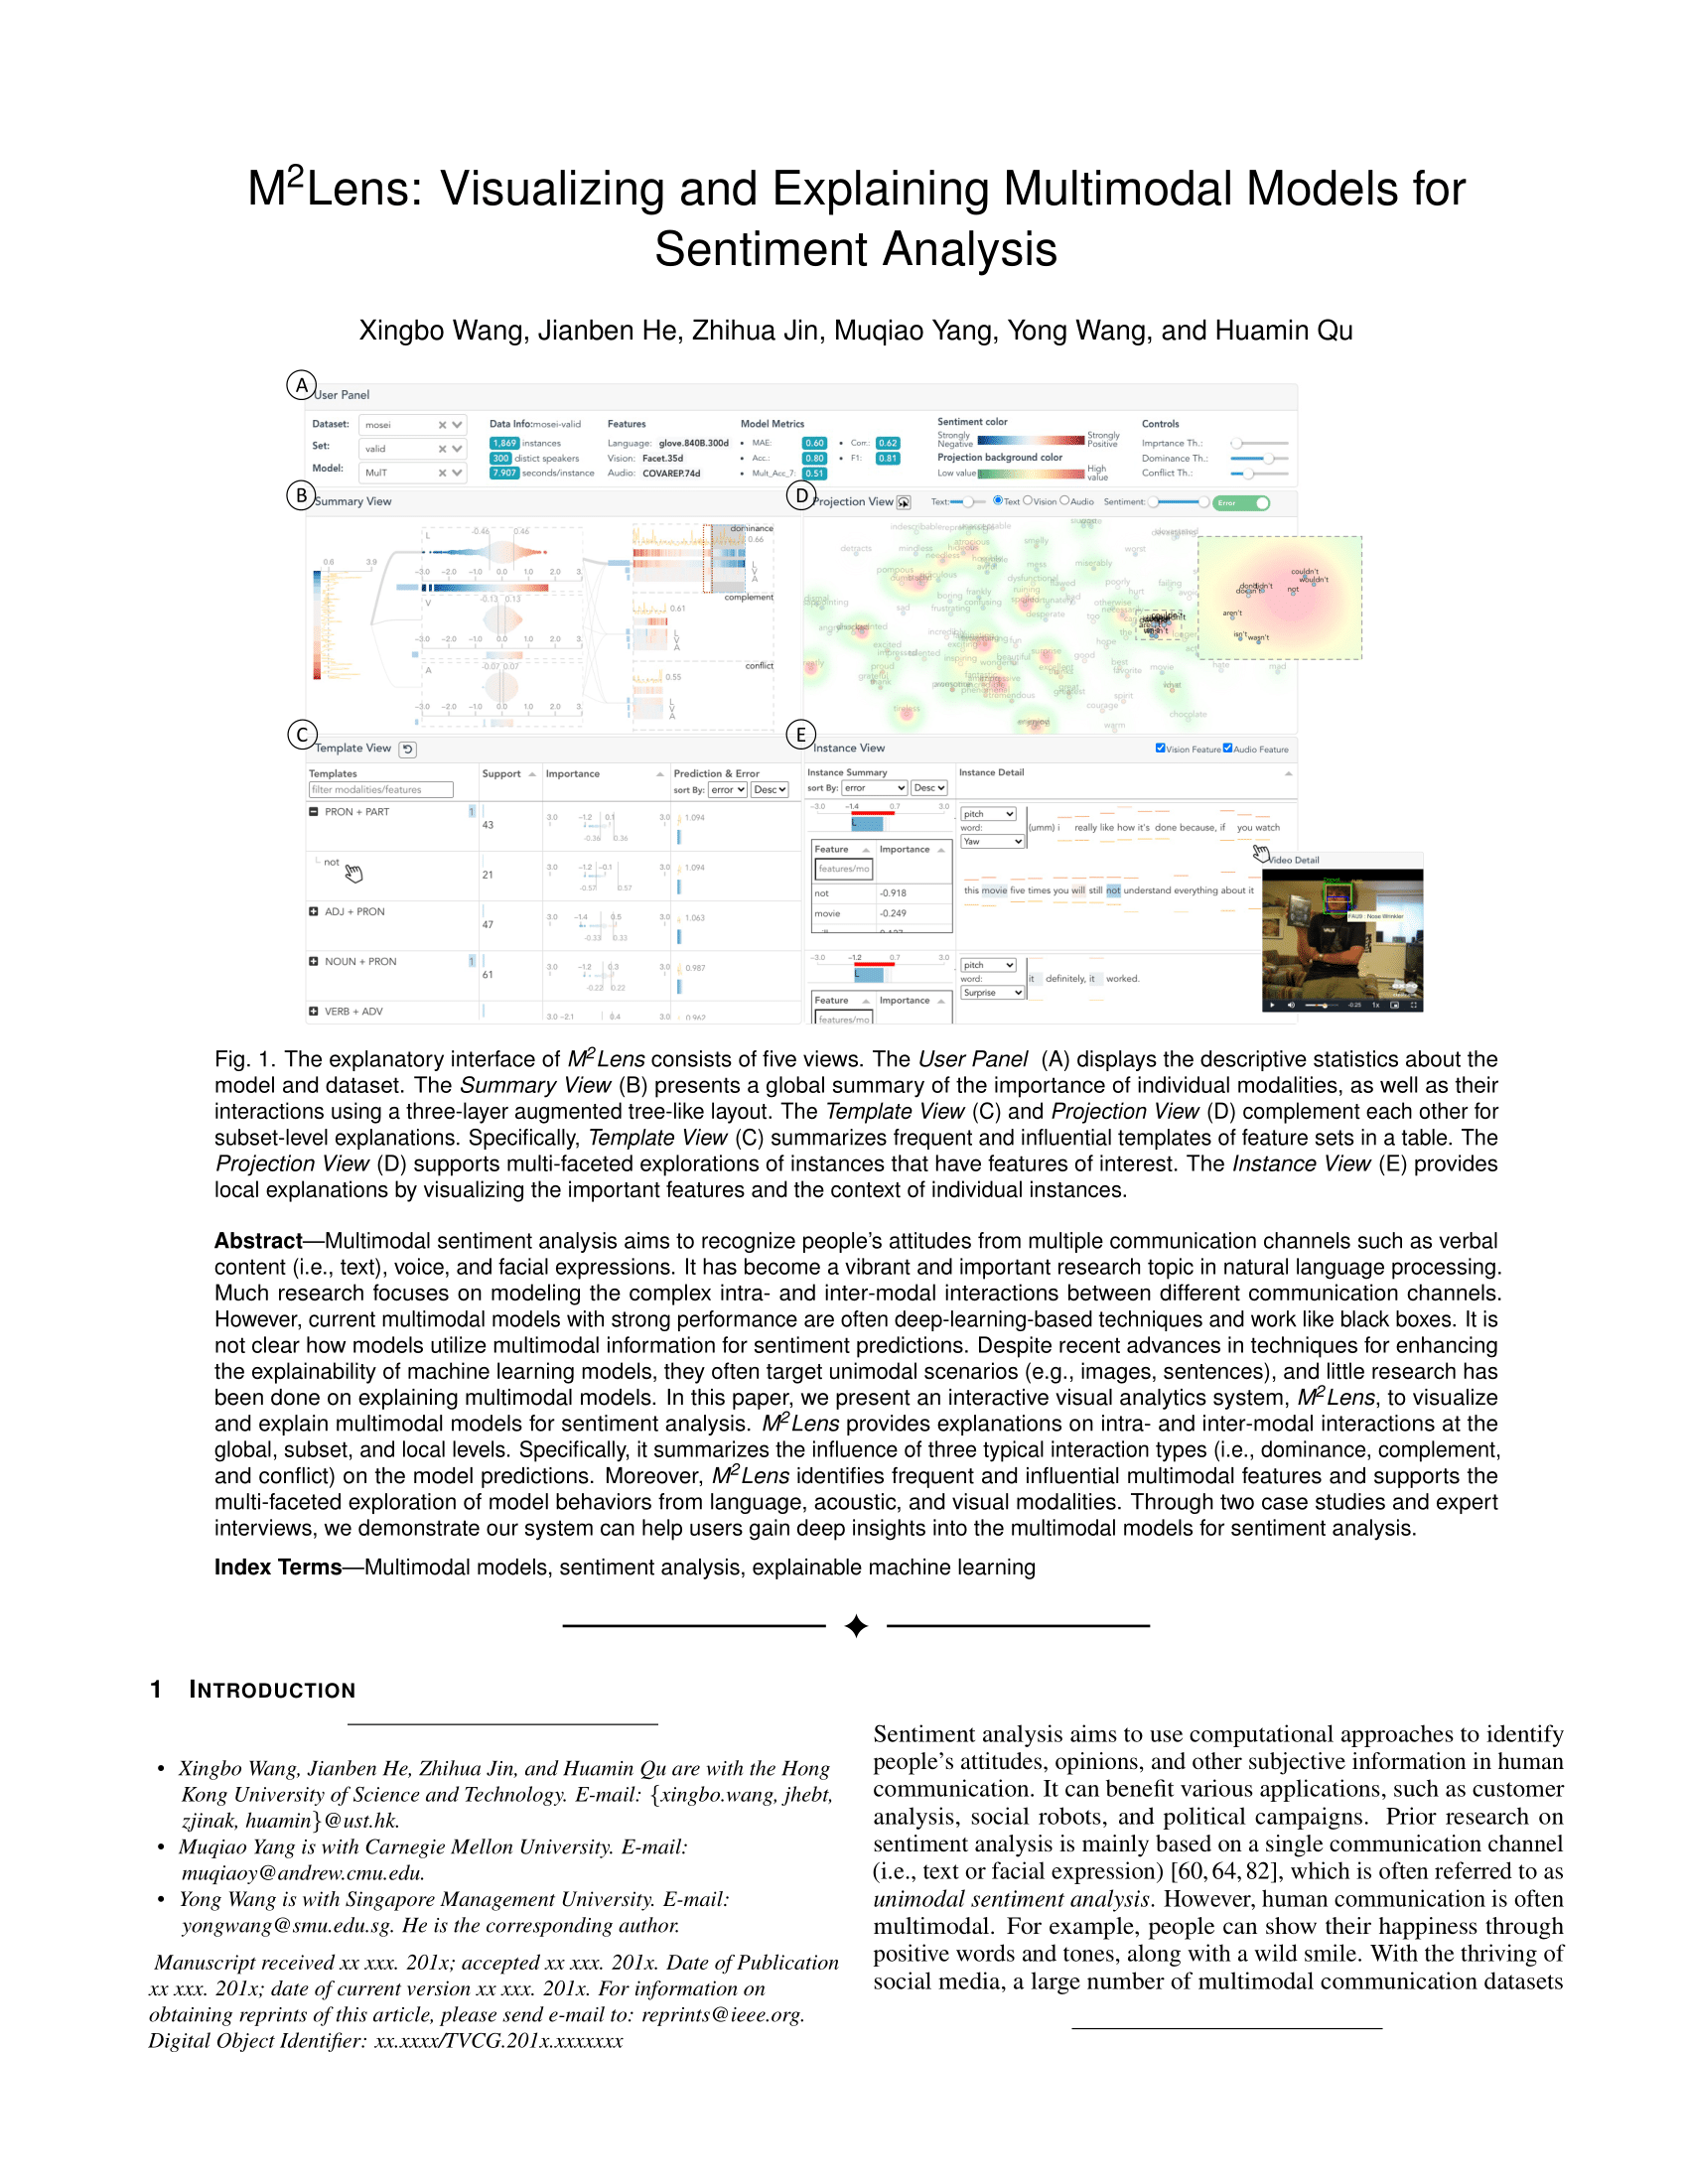
In this case study, the expert explored and diagnosed a state-of-the-art model, Multimodal Transformer (MulT), for sentiment analysis using the CMU-MOSEI dataset. MulT fuses multimodal inputs with cross-modal transformers for all pairs of modalities, which learn the mappings between the source modality and target modality (e.g., vision → text). Then, the results are passed to sequence models (i.e., self-attention transformers) for final predictions. All the multi-modal features of the input data are aligned at the word level based on the word timestamps. Following the settings of previous work, we trained, validated, and evaluated MulT with the same data splits (training: 16,265, validation: 1,869, and testing: 4,643).
In our paper, we demonstrate how M2Lens helps users understand and diagnose multimodal models for sentiment analysis through two case studies. Below we describe two such examples.
Example I: Dominance of Language Modality
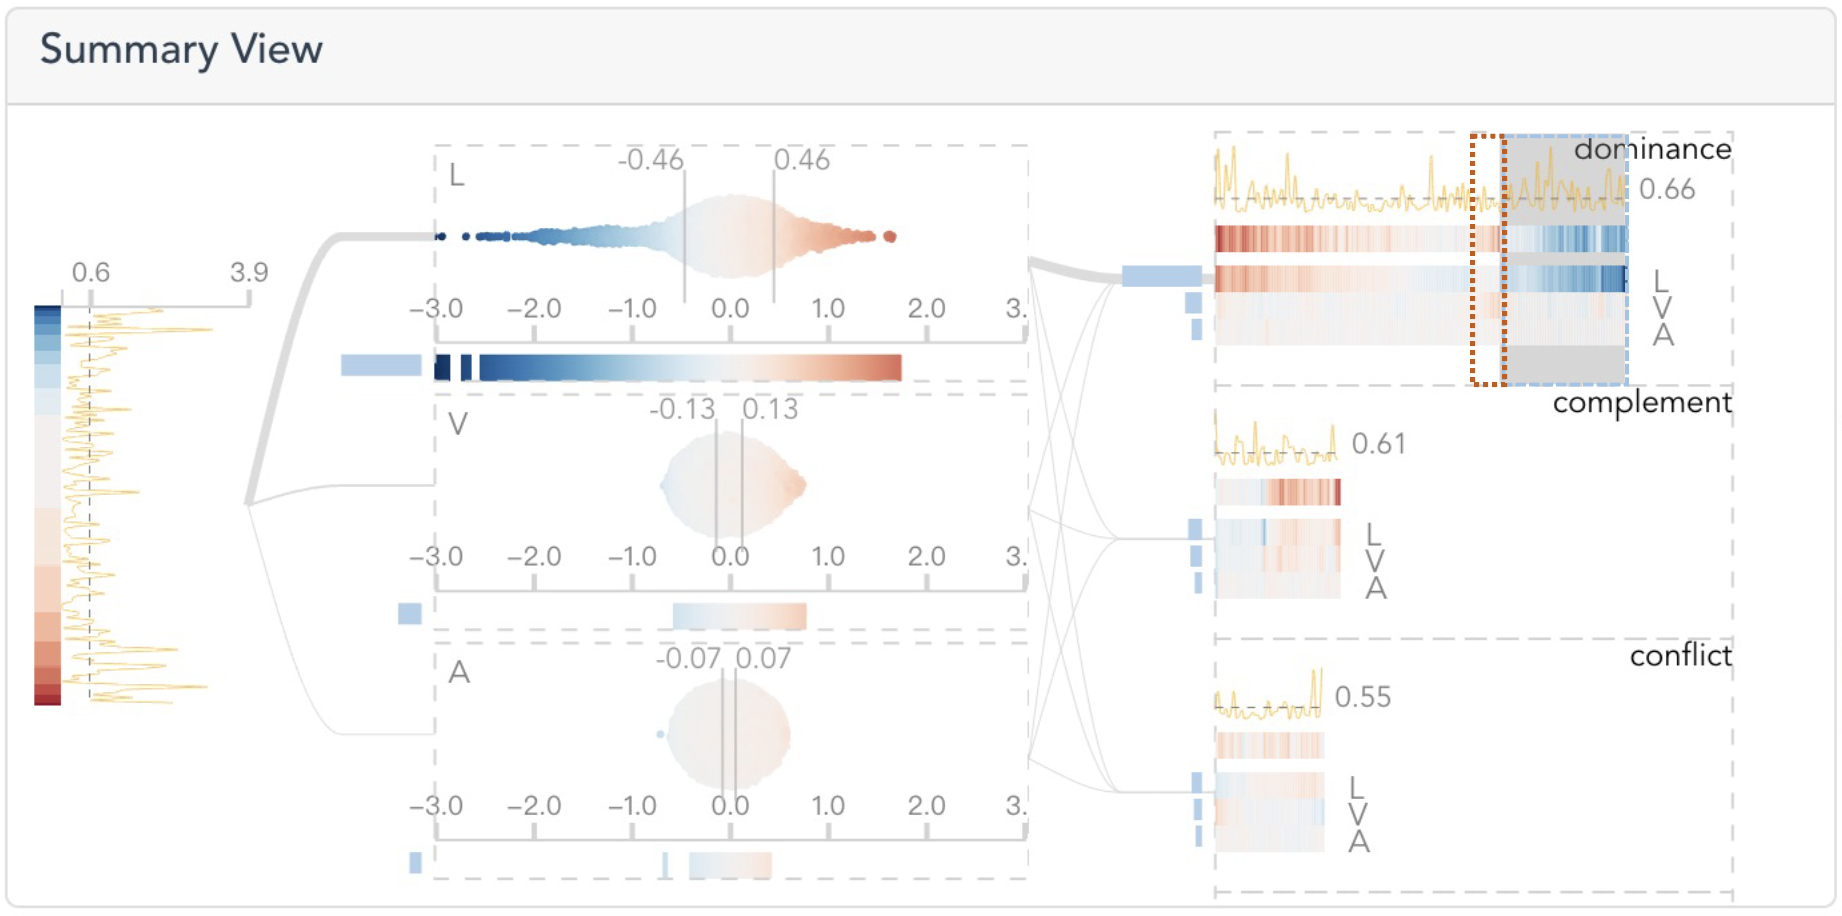
After loading the multimodal transformer in the system, an expert E1 referred to the Summary View to see how individual modalities and their interplay contribute to the model predictions.
The influences of individual modalities and their interplay are visualized in a three-layer augmented tree-like layout. The first layer shows the distributions of the groud truths and model errors. The second layers presents the importance of individual modalities in bee swarm plots. The third layer summarizes the information about the four interaction types
By looking at the second layer, E1 found that the language modality has the largest influence among the three modalities since it has the longest bar to the left and widest range of dots in the bee swarm plot.
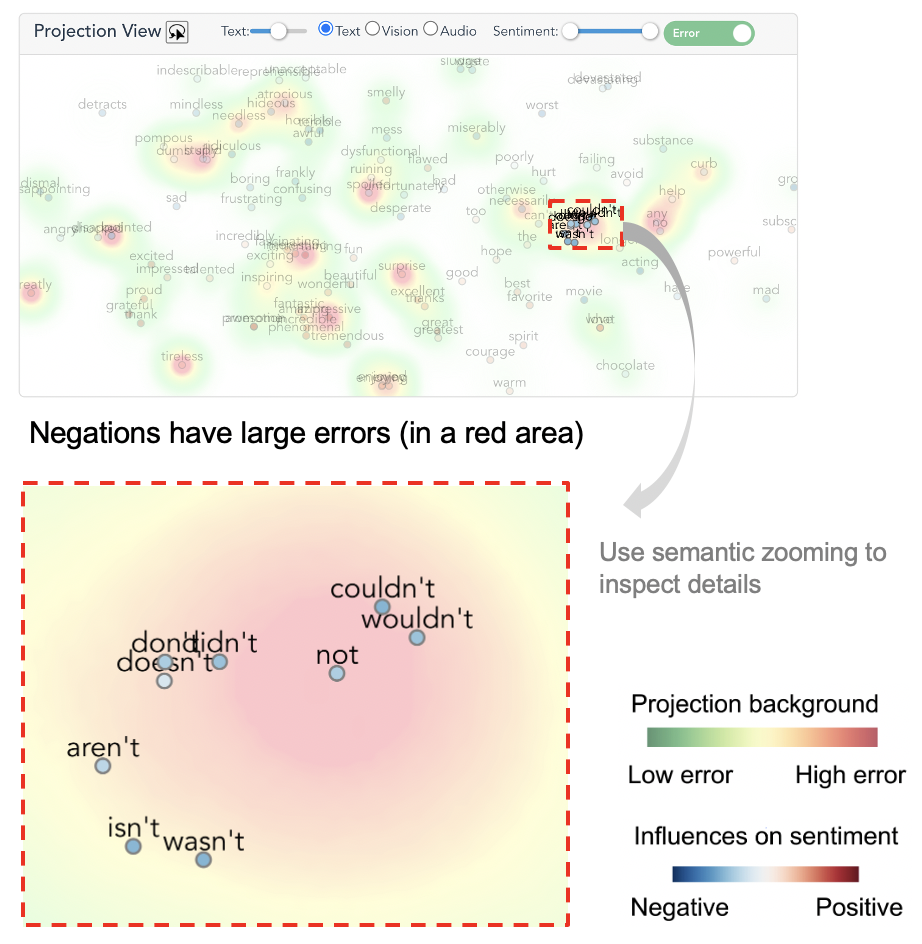
In the last layer, within the dominance group, he discovered that the longest bars attach to the language modality, and the color of the prediction barcode aligns well with that of the language barcode. Thus, E1 concluded that the language also plays a leading role in the dominance relationship. He noticed that there are a group of dense blue bars appearing at the end of the language barcode, where the errors are relatively large (as indicated by the yellow curve above the dashed line). He wondered what features or their combinations caused the high errors. Therefore, he brushed the corresponding area of the blue bars.
Then, the Template View lists the feature templates of the selected instance in the Summary View. By sorting them in descending order of error, E1 found that the “PRON + PART” appears at the top with a child feature. Then, he collapsed the row and found that 21 instances contain the word “not”, where it negatively influences the predictions.
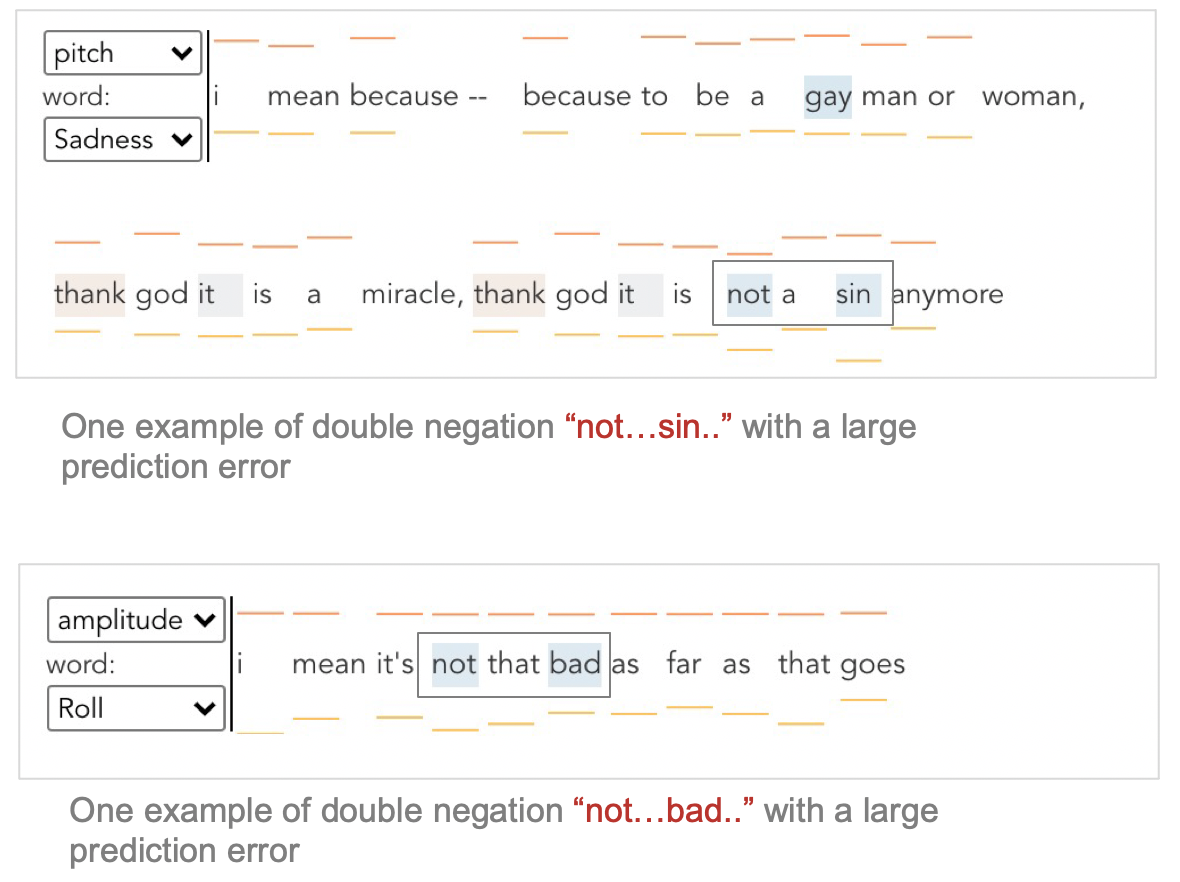
Next, he clicked “not” to see the details about this feature in the Projection View. Zooming in on the word “not”, several similar negative words (e.g., “isn’t”, “wouldn’t”) were observed. E1 speculated that the model could not deal well with negations. Subsequently, he lassoed these words to closely examine the corresponding instances in the Instance View.
When exploring the examples with large errors, E1 noticed that when double negations appear in a sentence (e.g., “not…sin…” and “not…bad…”) , the model tends to treat them separately and regards both of them as indicators for negative sentiment. He thought that augmenting double negation examples or preprocessing them into positive forms may improve the model performance.
Example II: Dominance of Visual Modality
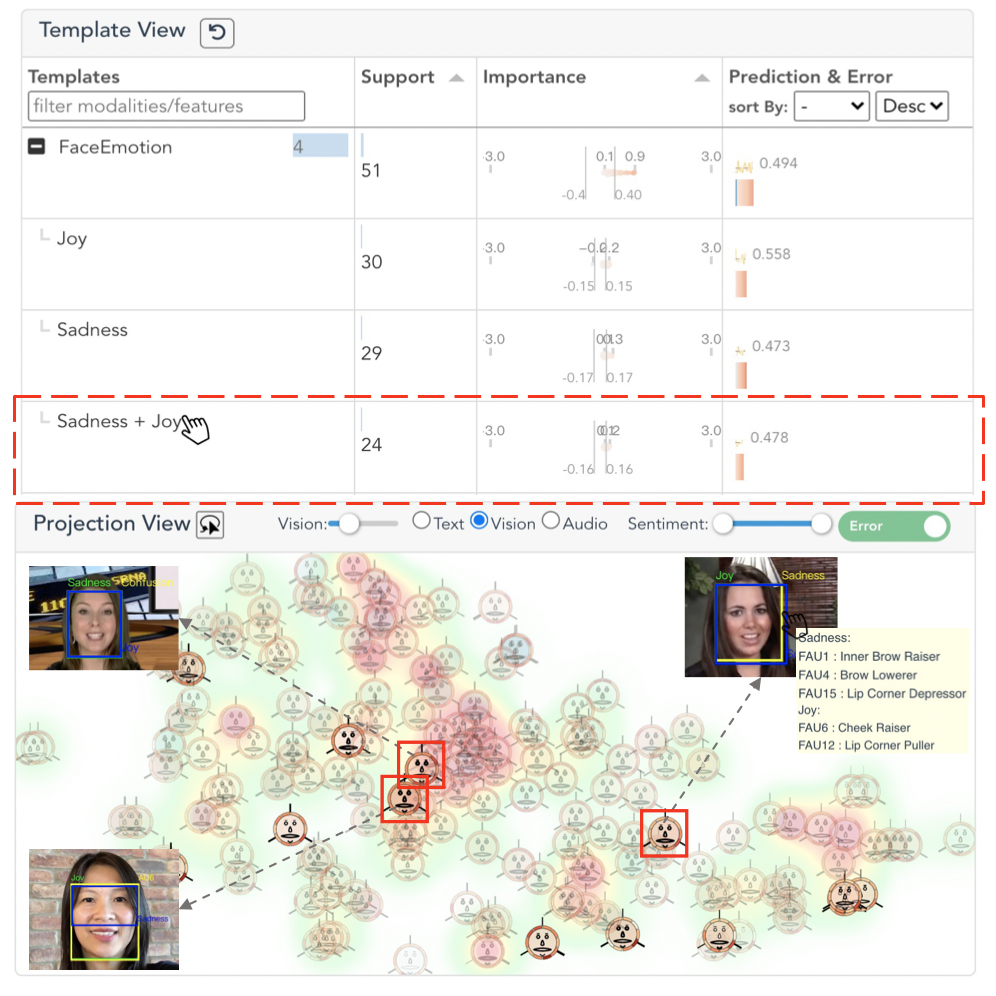
Afterward, E1 referred back to the “dominance” group in the Summary View, where a collection of red bars from the prediction barcode conform with the ones from the visual modality. It indicates that the visual modality dominates the predictions, and the error line chart above suggests a low error rate in contrast with the previous case. Motivated by this observation, E1 brushed the red bars to investigate the patterns in the visual features.
In the Template View, “Face Emotion” has the largest support. After unfolding the row, E1 found that “Sadness + Joy” is a frequent and important combination. This intrigued him to find out how a contrary emotion pair co-occurs. After clicking the template, the corresponding glyphs are highlighted in the Projection View. Most of them were found outside of the red area, which verifies that the instances with “Sadness + Joy” often have small prediction errors. Through browsing the instances and their videos in the Instance View, “Joy” and “Sadness” are often considered important to model predictions. Their co-occurrences may be due to the presence of intense and rich facial expressions in the videos. And the model seemed to capture these important visual facial expressions.
“Sadness + Joy” co-occurence patterns
Future Work
In summary, we characterize the intra- and inter-modal interactions learned by a multimodal model for sentiment analysis. Moreover, we provide multi-level and multi-faceted explanations on model behaviors regarding dominant, complementary, and conflicting relationships among modalities.
In the future, we can extend the system to other multimodal NLP tasks (e.g., emotion classification and visual question answering). And we can further conduct a comparative study of multimodal models, determing under what circumstances we should use multimodal models and when uni- or bi-modal models are sufficient for target applications.
M2Lens features
Check out the following video for a quick look at M2Lens’s features.
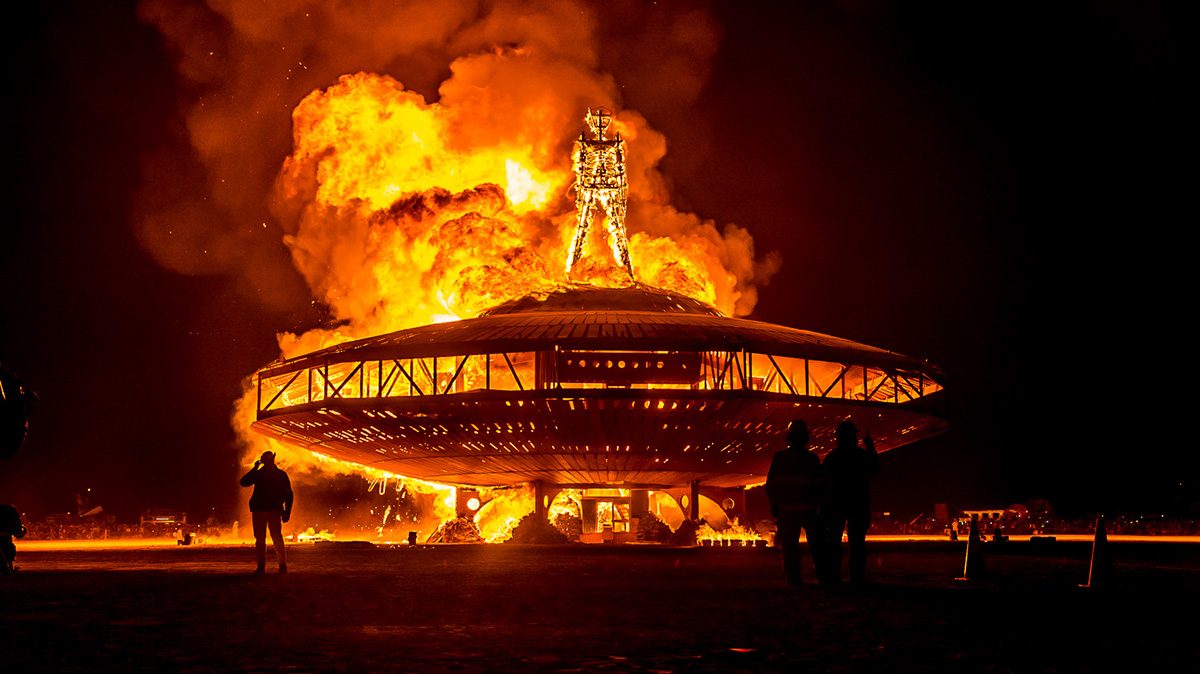
How can tourism be reborn? How can we reach states of awe? How can events become experiences that change people? Transformation is no longer a buzzword. In fact, we can use experience design principles to intentionally design transformative experiences – from opening glimpses and triggers towards long-term integration. In this research project, we look into attendees’ experiences of Burning Man shared on Instagram. By adopting a data analytics approach, we identify the socio-physical factors of human transformative experiences within and beyond the festival environment.
A three-phase methodological procedure
Phase 1 Data collection: To determine Instagram posts related to Burning Man, the hashtag #burningman2019 was used. In 2019, the 29th edition of Burning Man took place from August 25th through September 2nd. Based on this timeframe, we extracted posts published six months before the event, during, and six months after, resulting in a total of 53,326 posts. The extracted data, including captions (i.e., texts, hashtags, emojis), posts’ dates, posts’ URLs, and types of user account (i.e., business/personal).
Phase 2 Data pre-processing: First, language identification was applied in Python using Spacy to eliminate non-English posts. Next, business accounts and their corresponding posts, duplicates, and posts without a description were removed. This resulted in 35,802 usable posts: 8953 thereof published before the event, 2840 published during the event, and 24,009 published after the event. Thereafter, a list of stopwords was prepared, and irrelevant signs and unknown characters, numbers, and references to usernames with @ were removed. Slang words were reformed and hashtags, as well as emojis, were extracted.
Phase 3 Deep topological data analysis: A deep topological data analysis approach is a combination of topological data analysis and deep generative models. Concerning the former, the topic list is used as an embedding space for dimension reduction and further clustering. With the latter, the purpose is to learn the true data distribution of the training set to generate new data points with some variation. Depending on the data type, common approaches thereof include variational autoencoders and generative adversarial networks. The Vietoris-Rips algorithm was used to connect nearby data points to build topological structures, and nested complexes were used to identify persistent elements of the data structure using Morse Theory. Finally, the manifolds of the original dimensions were simplified and visualized.
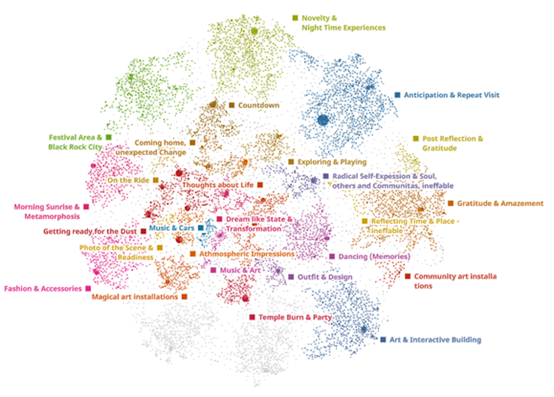
An overview of the results
The software DataRefiner was used to build thematic clusters and to visualize the topological structure of the data. The text was tokenized, and text parameters were identified by weighing the tokens. These parameters are the key terms that represent the different clusters and can be expressed via a correlation value between −1 and 1. By means of an iterative process, the number of clusters was adjusted until the number of noise points reached a suitable minimum, ultimately reaching 30 unique clusters.
From an epistemological viewpoint, the selection of the number of clusters and the interpretation thereof requires deep knowledge of a topic domain from a researcher. The naming of each cluster was based on extracted keywords, found parameters, and text summaries, following crosschecks and consensus among the research team. Finally, the graphical representation of the cluster map was visualized, presenting the topographic structure with similar clusters located close to each other. Clusters that are spatially opposite from each other show that their relevant parameters are fundamentally different, and the correlation of the parameters is close to −1. The detailed results can be found in our paper.
Our research outperforms prior studies that may suffer from the intrinsic drawbacks of traditional techniques. For instance, although LDA has been widely used in tourism research, it relies primarily on word co-appearance frequency. Relations between topics thus remain unknown. By showcasing the potential and usefulness of deep topological analysis in tourism research, in cases where the goal is to explore implicit messages based on short-text and unstructured Instagram data, our study supplies a robust and transparent compass to navigate through the epistemological and methodological questions and decision-making process – from theory-led research design and data collection to data analysis and theory generation.
How to cite: Neuhofer, B., Egger, R., Yu, J., & Celuch, K. (2021). Designing experiences in the age of human transformation: An analysis of Burning Man. Annals of Tourism Research, 91, 103310.
by: Egger, Roman, Oguzcan Gumus, Elza Kaiumova, Richard Mükisch, and Veronika Surkic In ENTER22 e-Tourism Conference, pp. 343-355. Springer, Cham, 2022.
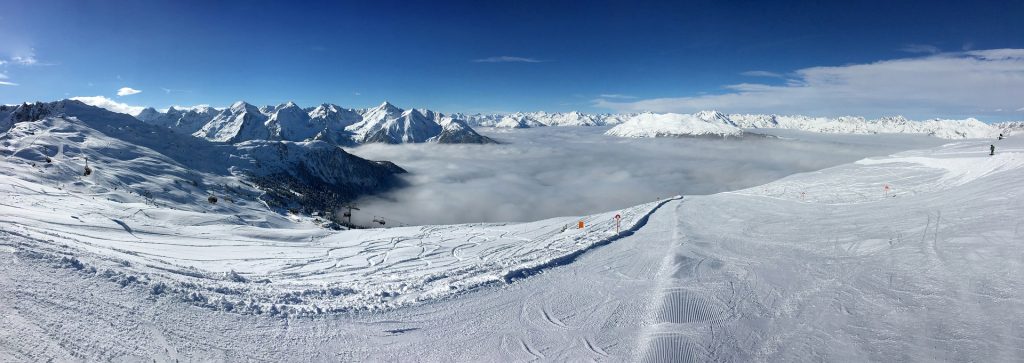
Social media plays a key role in shaping the image of a destination. Although recent research has investigated factors influencing online users’ perception towards destination image, limited studies encompass and compare social media content shared by tourists and destination management organisations (DMOs) at the same time. This paper aims to determine whether the projected image of DMOs corresponds with the destination image perceived by tourists. By taking the Austrian Alpine resort Saalbach-Hinterglemm as a case, a netnographic approach was applied to analyse the visual and textual posts of DMO and user-generated content (UGC) on Instagram using machine learning. The findings reveal themes that are not covered in the posts published by marketers but do appear in UGC. This study adds to the existing literature by providing a deeper insight into destination image formation and uses a qualitative approach to assess destination brand image. It further highlights practical implications for the industry regarding DMOs’ social media marketing strategy.
The presentation below is from the ENTER 2022 conference
Pls. cite as: Egger, Roman, Oguzcan Gumus, Elza Kaiumova, Richard Mükisch, and Veronika Surkic. “Destination Image of DMO and UGC on Instagram: A Machine-Learning Approach.” In ENTER22 e-Tourism Conference, pp. 343-355. Springer, Cham, 2022.
by: Egger, R., Pagiri, A., Prodinger, B., Liu, R., & Wettinger, F. In ENTER22 e-Tourism Conference (pp. 356-368). Springer, Cham
The needs of travellers vary across cultures. When it comes to culinary aspects, there is a strong connection between gastronomy and culture. To optimise service offerings, investigation of the essential aspects of dining experiences in relation to cultural backgrounds is of great importance. In the age of digitalisation, tourists share their dining experiences throughout their multiphasic travel journey via online platforms. By considering nine distinct cultural backgrounds, this research aims to investigate tourist experiences based on TripAdvisor restaurant reviews through topic modelling, using the city of Salzburg as its study context. Depending on one’s cultural circumstances, the findings demonstrate that the most important aspects include staff, food-menu items, value for money, restaurant physical appearance, food authenticity, overall service, menu offers, food quality, atmosphere, and recommendations. This study advances the state-of-the-art knowledge of societal culture as a variable in the target market analysis of restaurant customers. Findings allow restaurant owners, other tourism service providers, and destination management organisations to analyse and adapt their service offerings and strategies accordingly.
The presentation below is from the ENTER 2022 conference
Pls. cite: Egger, R., Pagiri, A., Prodinger, B., Liu, R., & Wettinger, F. (2022, January). Topic Modelling of Tourist Dining Experiences Based on the GLOBE Model. In ENTER22 e-Tourism Conference (pp. 356-368). Springer, Cham.
As a result of travel activities, overtourism has become a global issue. Even after the COVID-19 pandemic, the topic of overtourism would benefit localized overcrowding as a new occurrence in the tourism industry. To investigate tourists’ feelings when visiting overcrowded attractions, the analysis of online reviews has been recognized as a reliable source given the rich data it provides. In the digital area, reviews posted by tourists become critical in influencing one’s decision-making process. One typical example is TripAdvisor which enables tourists to consult reviews on any hotel, restaurant or attractions shared by other users.
Due to the unstructured nature of online data, topic modeling and sentiment analysis has gained their popularity. Topic modeling identifies the main topics of the reviews and is particularly suitable for exploratory studies. Sentiment analysis quantifies subjective information by natural language processing and computational linguistics. By taking overtourism (using Paris) as the research context, this study aims to uncover the most common issues when tourists visit overcrowded attractions and to reveal their feelings through text analytic techniques.
Data Collection and Data Preprocessing
All available English posts of the top 10 cultural-related attractions in Paris in TripAdvisor were extracted, resulting in a total of 140,712 posts published by any user as of the end of 2019. The attractions include Notre-Dame de Paris, Basilica of the Sacred Heart of Paris, Louvre Museum, Tour Eiffel, Centre Pompidou, Musée d’Orsay, City of Science and Industry, Museum of Natural History, Arc de Triomphe, and Sainte-Chapelle.
An open-source visual programming software, Orange 3, was applied for the following procedures. First, online posts were pre-processed. A list of stopwords was prepared to eliminate non-informative text. The remaining corpus was transferred to lowercase, where diacritics were transformed to the basic format. Next, text data was tokenized. All words were converted into their basic form, using lemmatization (e.g., traveling to travel).
Latent Dirichlet Allocation (LDA) Topic Model
This study applied LDA topic models to identify the underlying topics in an unstructured corpus such as customer reviews. Specifically, LDA views a document of text as a mixture of topics that disclose words with certain probabilities. However, due to the restriction of Orange 3 on the number of data instances, 5,000 posts were randomly selected for each attraction in Paris using a random selection in excel. LDA topic modeling was conducted to generate term clusters from the extracted reviews, which yielded 10 topics for each attraction based on the default setting of Orange 3. The degree of how a token contributes to a given review was revealed based on TF-IDF representation (term frequency-inverse document frequency).
Sentiment Analysis
In the next step, based on the identified topics, a lexicon-based sentiment analysis using the Vader algorithm was adopted to extract online users’ feelings based on the posts. Sentiments refer to feelings based on attitudes, emotions, and opinions; it determines whether an expression is positive, negative, or neutral. The results are presented by a numerical spectrum where −1 is the most negative, +1 is the most positive, and 0 suggests the neutral point.
Summary of the Results
LDA identifies 14 topics relevant to the issue of overcrowding and 10 general tourism-related topics. The table below presents the 14 overtourism topics and their corresponding average sentiment scores. The naming of the topic was based on the top keywords with the highest TF-IDF scores detected by LDA. For instance, the findings suggest that visitors felt most negatively about “safety and security”, “service and staff”, and “queues of customers”. Yet, the sentiment scores were higher regarding “social interaction”, “reputation”, and “overall atmosphere”. The detailed results can be found in our paper.
Unlike earlier research built upon existing measurements, this study takes one step further by exploratorily discovering the critical dimensions in managing tourist experiences at overcrowded attractions. Thus, this study contributes from a methodological angle by incorporating topic modelling technique and sentiment analysis to reveal tourists’ subjective perceptions. The technique applied in this study is beneficial to marketers who want to examine tourists’ feelings based on UGC elsewhere.
How to cite: Yu, J., & Egger, R. (2021). Tourist Experiences at Overcrowded Attractions: A Text Analytics Approach. In Information and Communication Technologies in Tourism 2021 (pp. 231-243). Springer, Cham.
Introduction: Online complaints have become increasingly influential on the purchasing behavior of customers in recent years. In an effort to analyze large quantities of textual complaints and detail the various aspects of them, Aspect-Based Sentiment Analysis was looked to as an ideal framework to take on the task.
Purpose: This study set out to synthesize specific service failure items and categorize them into the groupings related to the hotel guest cycle and the corresponding operations, then compare the patterns of expression used by Asian and Non-Asian guests as they related to their hotel experiences.
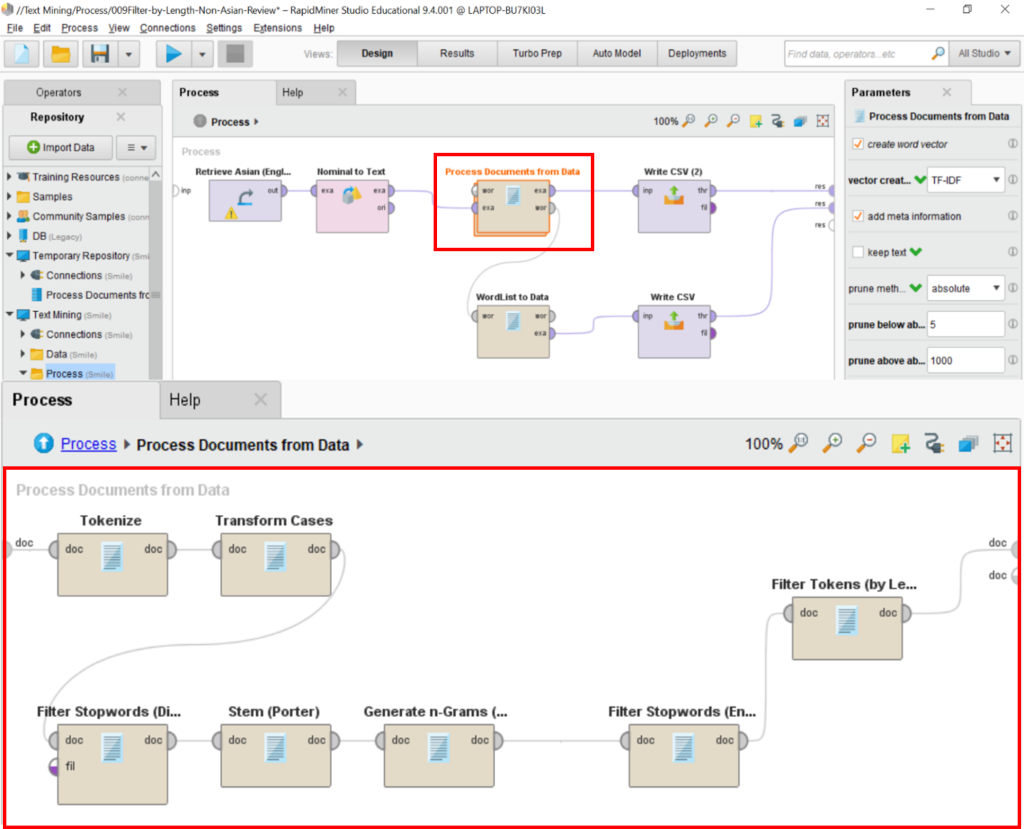
Design/Methodology/Approach: A total of 390,236 online complaint terms posted about 353 hotels in the UK by hotel guests from 63 nations were manually derived from TripAdvisor for analysis. In line with previous studies by Sezgen, Mason, & Mayer (2019); and Xu & Li (2016), the textual data was processed according to the following steps (see Figure 1). Then, to detect the aspect category, the researchers made use of terms that would be indicators of the presence of the aspect—these are referred to as Aspect Terms. Before the aspect-based sentiment analysis could be processed, the aspect terms and categories were identified (c.f. Sann & Lai, 2020). Finally, a list was compiled in which the extracted terms and aspects were organized in order of importance. These results were based on the co-occurrence frequency-based method (Brun et al., 2014; Schouten et al., 2018; Sharma & Waghmare, 2019).
Figure 1: Term pre-processing and reduction process.
Findings: With consideration given to the homophily theory, we posited that Asian and non-Asian guests would exhibit similarities and differences with respect to the service failures they encountered when presented with various items of service. The results confirmed this as Asian guests were shown to encounter more service failures with respect to the engineering segment of operations (e.g. hotel room equipment issues), while non-Asian guests encountered more service failures on the housekeeping end of operations (e.g. toilets, public areas, cleanliness, and bedding). By organizing the failures according to the four stages of the guest cycle, it was observed that approximately 80% of the service failures occurred during the occupancy period.
Originality/Value: This study contributes to the existing literature on hotel guest satisfaction both with respect to the methodology it uses and the new findings it presents on differences in perceptions of service failures members among different cultures.
References:
Brun, C., Popa, D. N., & Roux, C. (2014). XRCE: Hybrid Classification for Aspect-based Sentiment Analysis. Paper presented at the 8th International Workshop on Semantic Evaluation (SemEval 2014), Dublin, Ireland.
Sann, R., & Lai, P. C. (2020). Understanding homophily of service failure within the hotel guest cycle: Applying NLP-aspect-based sentiment analysis to the hospitality industry. International Journal of Hospitality Management, 91. 102678. https://doi.org/10.1016/j.ijhm.2020.102678
Schouten, K., van der Weijde, O., Frasincar, F., & Dekker, R. (2018). Supervised and Unsupervised Aspect Category Detection for Sentiment Analysis with Co-occurrence Data. IEEE Trans Cybern, 48(4), 1263-1275. doi:10.1109/TCYB.2017.2688801
Sezgen, E., Mason, K. J., & Mayer, R. (2019). Voice of airline passenger: A text mining approach to understand customer satisfaction. Journal of Air Transport Management, 77, 65-74. doi:10.1016/j.jairtraman.2019.04.001
Sharma, G., & Waghmare, M. (2019). Review Summarization and Aspect Category Detection with Co-occurrence data by refining Word Embeddings. International Journal of Scientific Research and Review, 07(05), 58-65.
Xu, X., & Li, Y. (2016). The antecedents of customer satisfaction and dissatisfaction toward various types of hotels: A text mining approach. International Journal of Hospitality Management, 55, 57-69. doi:10.1016/j.ijhm.2016.03.003