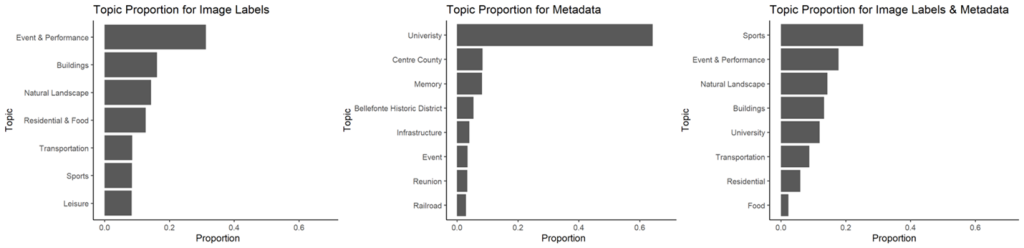
Recent tourism research has adopted social media analytics to examine tourism destination image (TDI) and gained timely insights for marketing purposes. Comparing the methodologies of social media analytics and intercept surveys would provide a more in-depth understanding of both methodologies and a more holistic understanding of TDI than each method on their own. This study aims to investigate the unique merits and biases of social media analytics and a traditional visitor intercept survey.
Methodology
This study collected and compared data for the same tourism destination from two sources: responses from a visitor intercept survey (n=1,336) and photos and metadata from Flickr (n=11,775). Content analysis, machine learning, and text analysis were used to analyze and compare the destination image represented from both methods. In particular, Latent Dirichlet Allocation (LDA) was the main topic modeling approach.
Findings
The results indicated that the survey data and social media data shared major similarities in the identified key image phrases. Social media data revealed more diverse and more specific aspects of the destination, whereas survey data provided more insights in specific local landmarks. Survey data also included additional subjective judgment and attachment towards the destination. Together, the data suggested that social media data should serve as an additional and complementary source of information to traditional survey data.
Originality
This study fills a research gap by comparing two methodologies in obtaining TDI: social media analytics and a traditional visitor intercept survey. Furthermore, within social media analytics, photo and metadata are compared to offer additional awareness of social media data’s underlying complexity. The results demonstrated the limitations of text-based image questions in surveys. The findings provide meaningful insights for tourism marketers by having a more holistic understanding of TDI through multiple data sources.
by Leyla Atabay & Beykan Çizel Journal of Tourism and Services, Vol. 11 No. 21 (2020) Link to Paper: https://jots.cz/index.php/JoTS/article/view/163
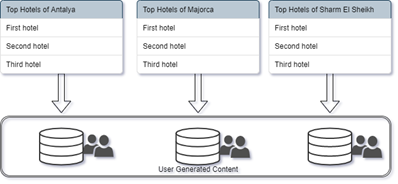
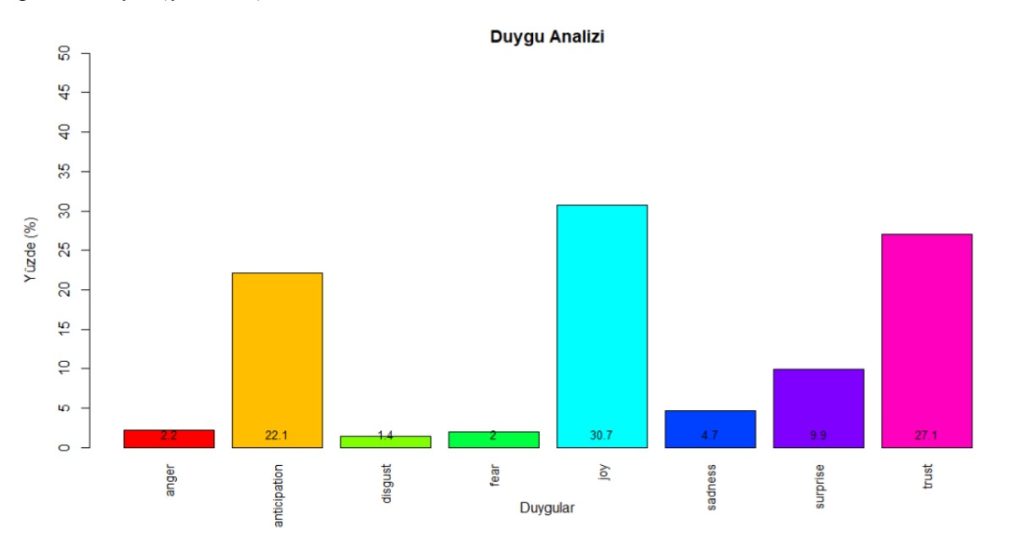
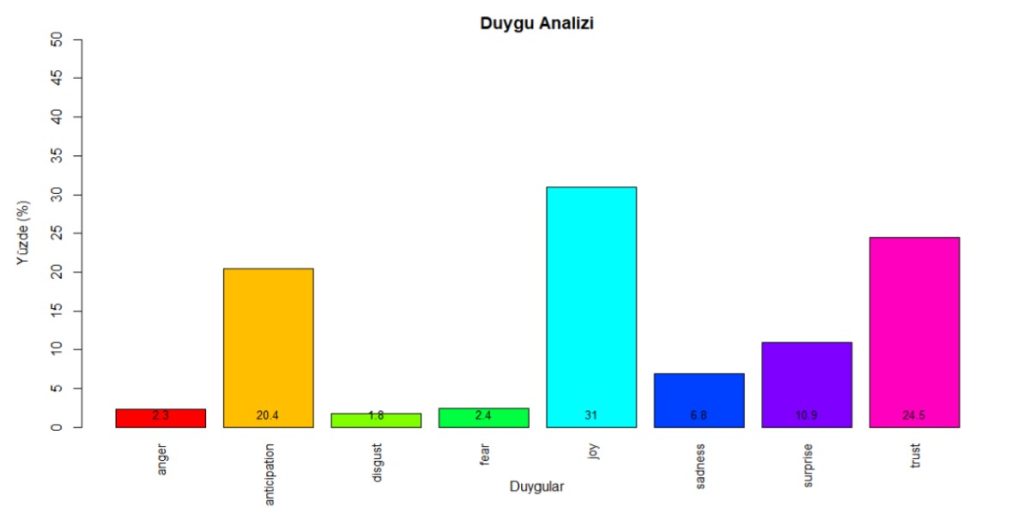
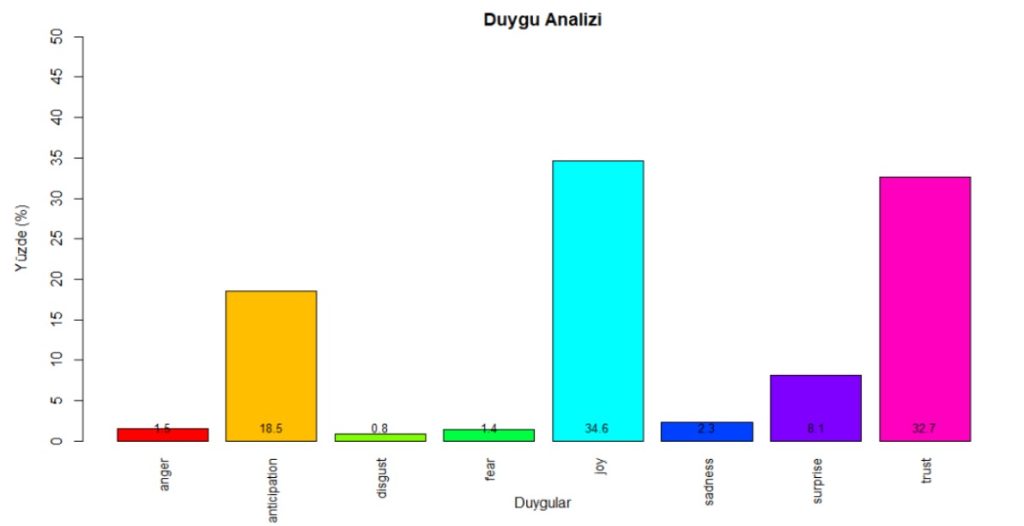
With this paper, we aimed to obtain meaningful themes and emotions from traveler reviews of hotels in three mass tourism destinations (Antalya, Majorca, Sharm El Sheikh). For that, we asked three main questions.
1) What are the features of the service components of the mass tourism destination hotels?
2) What are the emotions that arise from the analysis of hotel reviews according to mass tourism destinations?
3) What are the similarities and differences between the tourists’ emotions about the service components of hotels operating with the same concept in different mass tourism destinations?
Figure 1: Hotel Selection – Source: own processing
In order to answer these questions and scale the data, we determined the most liked 9 hotels (3 in each) in 3 destinations with similar characteristics and collected a total of 3588 reviews. At this point, we preferred the “rvest” package (rvest.tidyverse.org) in the leading R program in data mining applications and coded a script data from a hotel review website. We also used dplyr, tidytext, readxl, tm, syuzhet, wordcloud, lubridate, ggplot2, reshape2, rlang, and purrr packages for the other analyzes process.
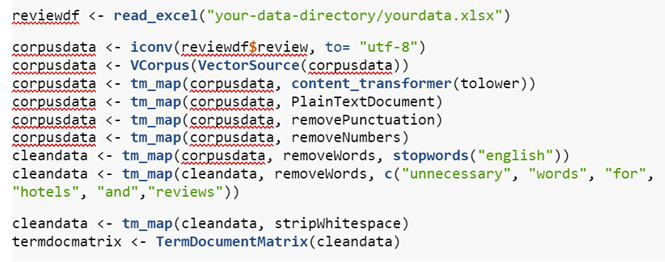
After collecting the data, we moved on to the “pre” data cleaning process. First, we fixed or deleted the corrupted characters in the corpus data. Then we combined the words that would be synonymous with each other and the plural forms of the words. Thus, we created a file ready for cleaning in the R program.
In the data cleaning process, R offers some auxiliary functions. We would like to present some examples of these below.
As can be observed in the codes, we first defined an excel file, namely “reviewdf”. Then we specified which column to read and moved on to the steps of cleaning the corpus data. First, we converted all letters to lowercase. In the second step, we defined it as plaintext. In the third, fourth, and fifth steps, respectively, we removed punctuation, numbers, stopwords. In step six, we deleted any other words we believed were unnecessary for this data. Thus, we also had to clean up the “whitespace” created in the previous steps.
Immediately after cleaning, we defined a term-document matrix in the clean dataset and created wordclouds to understand the main themes of reviews.
Figure 2: Wordclouds – Source: own processing
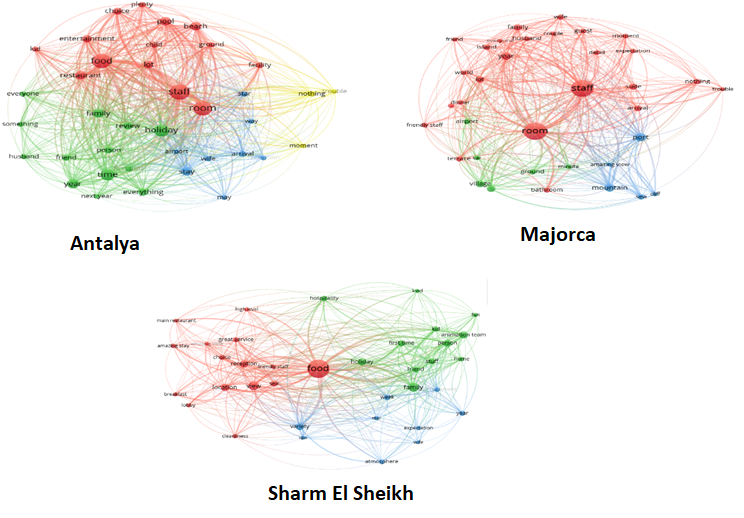
However, wordclouds were not enough to understand the importance of themes and which service components they are related to. For this reason, we thought it would be more informative to create a network analysis from the data and calculate the link strengths between nodes (namely words in reviews). So we created word networks for three destinations.
Figure 3. Review Networks – Source: own processing
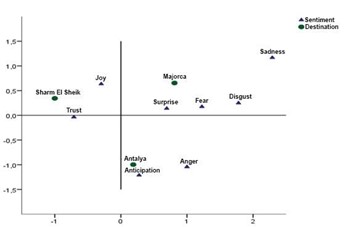
Comparison of reviews with the help of previous analyzes was hardly possible. More precisely, it was clear that the comparison was based on the visual reading capability of the reader. To overcome this problem and answer the third research question, we applied “Correspondence Analysis”.
Figure 5: Correspondence Analysis
Our findings highlighted the most important service features and prevailing emotions for hotels in Mediterranean destinations. Furthermore, the results of the multiple correspondence analysis revealed how emotions towards hotel services differ in three different destinations.
References
Atabay, L., & Çizel, B. (2020). Comparative Content Analysis of Hotel Reviews by Mass Tourism Destinations, Journal of Tourism and Services, 21(11), 147-166. doi:10.29036/jots.v11i21.163
Plutchik, R., (1980). Emotion: A Psychoevolutionary Synthesis, New York: Harper & Row.
Have you ever thought about why you ‘liked’ and ‘commented’ on some of the photos on Instagram, and some not? Certainly, content matters. However, when you need to browse through hundreds of Instagram posts, one of the subtle factors that may unconsciously influence your behavior is the color of the image. Color, as one of the major components in tourism aesthetics, influences human physiological responses and leads to changes in our online behavioral reactions.
Yet, the interplay between pictorial content and user engagement remains unclear and difficult to investigate. Our study applies a machine learning approach in order to investigate the role of color in influencing user engagement on Instagram based on tourism pictures with different features.
A six-step methodological procedure
Step 1 Picture selection: To identify tourism photos as the data sources on Instagram, the most commonly mentioned typologies summarized by previous literature were treated as hashtags to facilitate the data crawling process. They include “#beach”, “#mountain”, “#heritage”, “#forest”, “#gastronomy”, “#temple”, “#lake”, “#museum”, and “#cityscape”.
Step 2 Data extraction: A total of 7,887 public posts published between 2017 and 2019 were crawled, including the date, page URLs, image URLs, username, and the number of likes and comments. Yet, because engagement rate changes logarithmically, data was re-collected from the page URLs after 14 days of the first data extraction. After excluding the posts removed by the users, the final dataset contained 4,757 pictures.
Step 3 Image annotation and clustering: Because hashtags do not necessarily reflect the pictorial content (e.g., one might post a selfie with #mountain when hiking), we re-assigned the extracted pictures. Specifically, the image labels (i.e., the entities of a picture such as general objects, locations, activities, and animal species) annotated by Google Cloud Vision API were transformed into vectors using tf-idf value, indicating to what extent a label contributes to a picture. Next, the Louvain algorithm was applied to convert the detected labels into several clusters based on highly interconnected nodes (entities in the data). The image labels were considered as the edges (relationships between those entities) that connect different pictures, forming an image-network-graph and leading to a clustering of highly-connected images.
Step 4 Calculation of engagement rate: The next step was to calculate the average engagement rate of each identified cluster by taking the total number of likes and comments of a post and dividing it by a given user’s follower numbers.
Step 5 Color conversion: Google Cloud Vision was applied to detect a picture’s dominant colors. Cloud Vision returned up to 10 RGB values and their representative scores for each image. To ensure that the color presented is in line with human visual perception, RGB color codes were converted to hue, resulting in 12 major colors: orange, orange-yellow, yellow, yellow-green, green, blue-green, blue, blue-violet, violet, violet-red, red, and red-orange. Finally, to attain the percentage of color across the entire image, an individual color’s score was divided by the sum of all the scores returned from Cloud Vision.
Step 6 Implementation of machine learning methods: To analyze the relationship between color and the engagement rate of each cluster, auto machine learning with SVM and random forest was conducted. The engagement rate was selected as the target variable, and the color attributes were treated as input variables for prediction. Note that only the attributes that would contribute most to the quality of the resulting model were selected.
SVM and random forest were implemented based on the automatic optimization feature, optimizing the number of trees for the random forest and the gamma and C hyperparameter for SVM. The contribution of the model’s selected color was ranked based on weight vectors, which were calculated using a local interpretable model explanations (LIME) method. Specifically, LIME generates random samples around neighboring inputs and finds correlation weights for each input in the dataset. By summing up the weights of the color attributes based on their extent of contribution to engagement rate, a final output is given.
An overview of the results
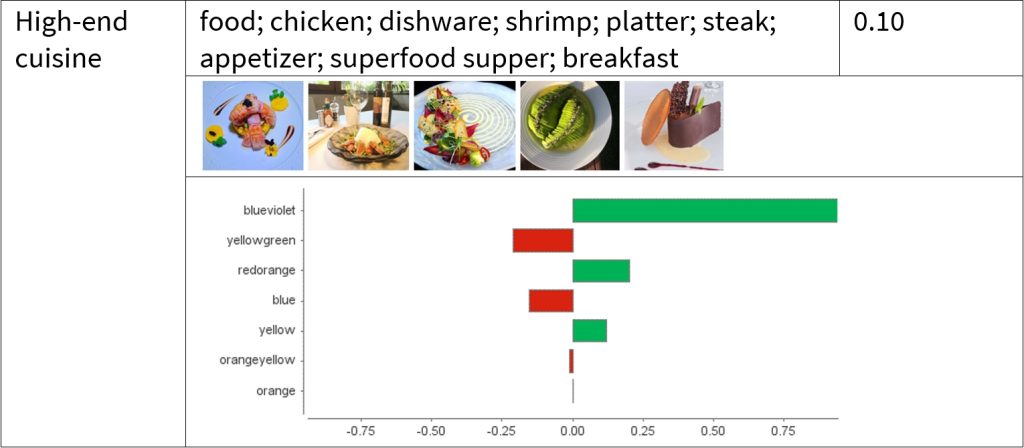
The Louvain algorithm generated 24 image clusters. The labels with the highest tf-idf value were included as keywords to facilitate the naming process of each cluster. Concerning the effects of color, since the accuracy score of SVM was better than the random forest’s in most of the cases (by evaluating MSE and RMSE), the results from SVM were presented.
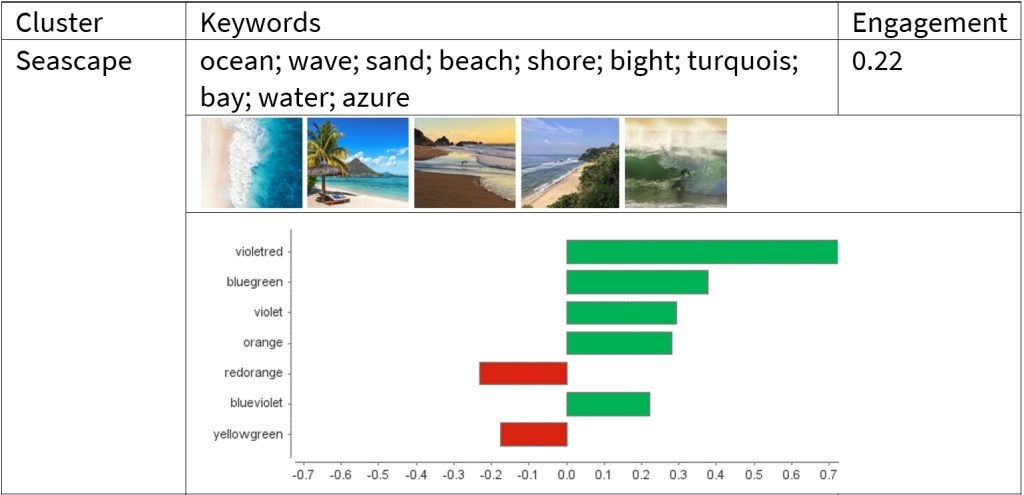
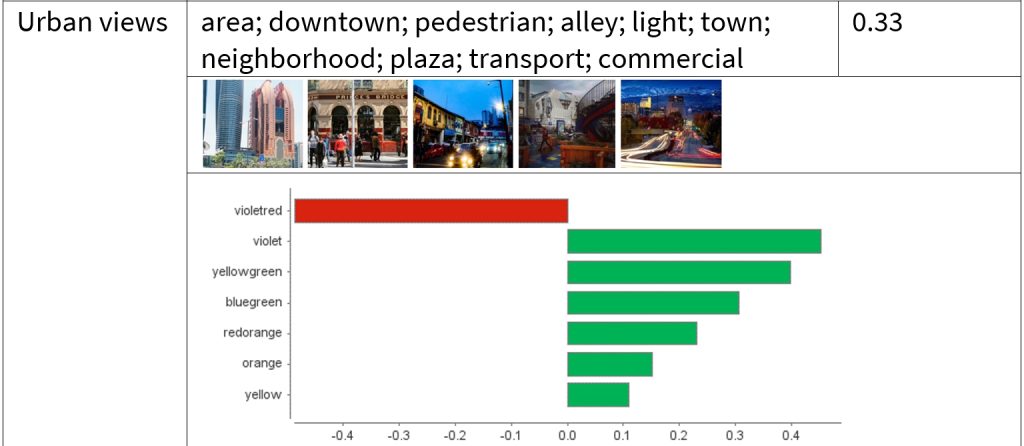
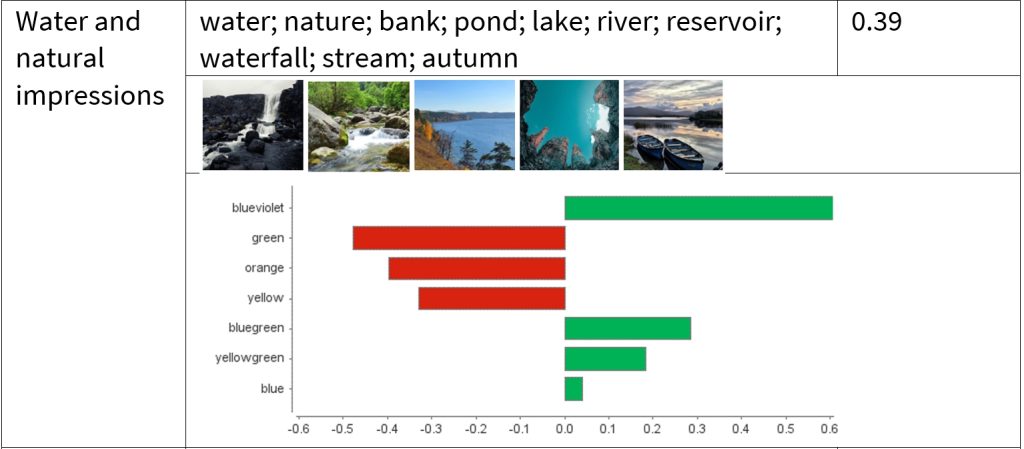
The table below provides four image clusters as examples, followed by the results of SVM. Notably, LIME used in SVM returns local weights and only focuses on the most relevant ones. For instance, violet has the highest weight in “urban views”, while violet-red conquers in “seascape” and blue-violet in “water and natural impressions” and “high-end cuisine”. Take “high-end cuisine” as an example, to achieve the highest engagement rate possible within this cluster, a picture should be composed more of blue-violet shades while slightly minimizing yellow-green and blue touches. The detailed results can be found in our paper.
Overall, applying SVM to Instagram data offers a new form of analysis for tourism and digital marketing. Our study provides a hands-on guide for marketers to bring images presented on Instagram to light in order to optimize their marketing content based on consumers’ preferences and interests. Meanwhile, our research provides some indications as to where and how future studies could collect data in a more structured fashion.
How to cite: Yu, J., & Egger, R. (2021). Color and engagement in touristic Instagram pictures: A machine learning approach. Annals of Tourism Research, 103204.
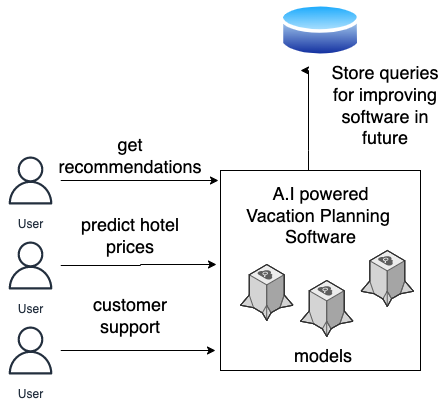
AI(Artificial Intelligence), also known as the “new electricity” (Jewell, 2019), is becoming the fuel of every new technology getting invented in the 21st century. Every new startup is joining this bandwagon to convert their million-dollar ideas into reality. Although the travel industry does not seem to have anything to do with this scientific technology, the travel giant companies are experimenting where it can fit best to bring it into action. There are many use cases where AI is taking some of the work that was previously done by domain experts. Vacation planning is one of those areas of the travel industry where AI can be expected to play a perfect role due to a plethora of reasons.
Generally, people interact with vacation planning software when they find it difficult to pick an option from myriads of alternatives available or when they are looking for new options they hadn’t explored before. AI can provide personalized suggestions and recommendations in such scenarios. For example, planning a visit to a new place can be daunting since there are a lot of things to be prepared for prior to travelling such as knowing about that particular place, culture, and people. It will take a lot of time to research this information by visitors themselves and pick their preferences. But if this AI comes to play then AI can easily recommend popular and trending activities from those places based on what the visitor likes or previously liked. There are many approaches to build a recommendation system for the travel industry. Some of the common approaches are:
Deep Learning Based:
If we have a huge amount of data readily available, this is the most effective and efficient way to build a recommendation system. This approach does not require much expertise in feature engineering too, since we let an algorithm pick and prioritize features. The input to the algorithm can be the historical data of travellers, their activities and other patterns and output is a model that can predict accurate recommendations based on inputs for new users.
Content based:
In this type of recommendation, we recommend the contents that have very similar attributes. For example, we can recommend hotels that have similar amenities to the one the user is/was searching for.
Collaborative Filtering:
In this type of filtering, we recommend to the visitors what other similar visitors liked. For example, if a 25 years old male adult books a hotel with an infinity pool, it is also likely other males with the same background will book hotels with the same/similar amenities.
Not only can AI algorithms learn to give the best planning experience based on other previous travelers, they can also deal with many visitors at the same time. If this task was to be done by humans, it would be nearly impossible to streamline a lot of requests during peak vacation seasons. The AI-powered conversational assistants can also provide instant and optimized recommendations. For example, visitors generally like to get a quick response to their vacation plan so that they can alter something if they don’t like it. This loop becomes very quick with AI. We can achieve this personalization in scale with minimum cost.
AI software serving multiple requests synchronously
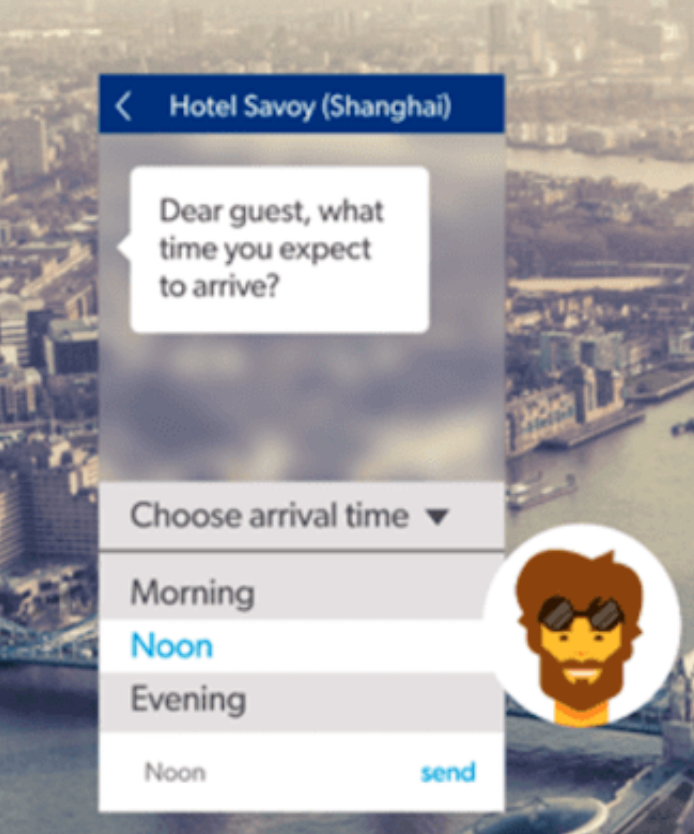
AI-powered chatbots that sit on our favorite messaging platforms can help to fully automate vacations like booking an Airbnb or hotels and interacting with hotels about the arrival and departure of visitors so that hotels and vacation rentals can easily manage their check-in/checkouts efficiently. Sometimes guests will have to wait for a few hours before they can be welcomed into the hotels but with this AI technology, we can simply alert visitors about the time so that they won’t have to waste the precious time waiting for the room to be ready.
AI can be more helpful for solo travelers as well. When they are not sure about their plan, AI can accompany them. It can also help to predict the perfect time to get the best deals for booking. It can act as a virtual travel guide so that it can assist people where to go and what to do for a particular location. It can also help visitors to carry out activities successfully as well. For example, mountain hiking depends upon the weather conditions of the mountains. If the weather condition is not right then, AI can suggest travel to another similar location so that they won’t have to compromise on the experience they will get.
Vacation does not always go as expected. Visitors will have to change their plans in the middle of their stay due to time or budget constraints. In such a case, AI can automatically optimize the stay/visits to optimize the resources like time and money. Sometimes we feel that the duration we allocated for vacation is not enough and we want to extend the duration. In such cases, sometimes the vacation rentals can charge more than expected. In such cases, AI can provide the best suggestions possible based on the budget we have. Different types of optimization functions can be used for this case. Some of the popular ones are Adam Optimisation and Gradient Descent Optimisation.
Especially for people who don’t travel frequently, predicting cost upfront before travel based on activities or stay is a difficult task. In such cases, experts can give the best suggestions but in this age of artificial intelligence, it can be done by digital domain experts like bots and provide the tentative amount for their personalized travel plan.
One more win scenario for AI in the travel industry is also that people love to share things with bots rather than with people about their vacations due to privacy reasons. Sharing travel plans with humans might also bring other risks such as information misuse.
The part where AI shines is that it takes parameters like a number of people, amenities, budget, duration of stay, and finds the best deal possible for the particular time. The optimization algorithms behind can be trained to optimize based on the end goal of visitors. For example, these are the common end goals of most visitors – budget, experience, time. If the end goal is clear, AI can help plan vacation in the best way possible.
All of the above areas of AI in the travel industry are just the tip of the iceberg of what is possible. The new travel industry revolution is the space travel for which AI is going to be an integral part. The virtual sci-fi experience which we used to get from the movies is going to be real soon. AI together with augmented reality are the future of the travel industry which we are yet to experience in near future.
* How Bayesian networks function * How to plot and interpret a directed acrylic graph (DAG) * How to calculate conditional probabilities with bnlearn
Bayesian networks are quite an intuitive tool when it comes to examining the dependencies between different variables. Specifically, a DAG (or directed acyclic graph) is what allows us to represent the conditional probabilities between a given set of variables.
Using the bnlearn library in Python, let’s take a look at how such analysis can allow us to glean insights on dependencies between different attributes of hotel customers.
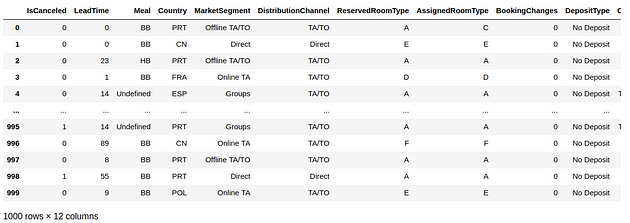
Background
The hotel booking data used in this analysis is from Antonio, Almeida, and Nunes (2019). Taking a dataset of different hotel customer attributes such as whether the customer canceled or not, their country of origin, market segment, etc — 1000 observations from the dataset were drawn at random.
Source: Jupyter Notebook Output, dataset by Antonio, Almeida and Nunes (2019)
Data Processing and DAG Generation
We will first convert the data into a one-hot data matrix. This function works by auto-detecting the relevant data types and implementing one-hot encoding where necessary:
dfhot, dfnum = bn.df2onehot(df)
Now, we will generate the DAG.
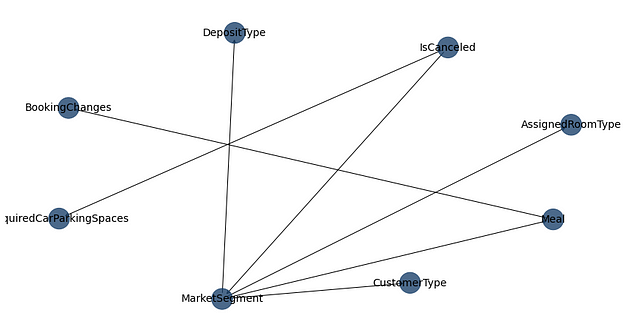
Firstly, the root node is set to IsCanceled, i.e. whether the customer canceled their hotel booking or not. We are setting this as the root node in this case — as we are particularly interested in examining how the different customer attributes affect cancellation behaviour in particular.
Additionally, we also choose to discard certain variables such as Lead Time, as we are primarily interested in analysing categorical features across the dataset and assigning a probability of cancellation based on the different categories included in each feature.
Features that are closely linked with others in the dataset are discarded. For example, ReservedRoomType is closely linked with AssignedRoomType — and thus the decision was taken to discard the former.
As above, we can now see a web-like graph of dependencies between the variables.
For instance, IsCanceled seems to demonstrate a strong conditional probability with MarketSegment and RequiredCarParkingSpaces. In other words, customers from a certain market segment are more likely to cancel than others, and the availability of car parking spaces also seems to be quite influential in whether a customer chooses to cancel or not.
In turn, the MarketSegment variable seems to show a significant dependency with AssignedRoomType and DepositType, among others. For instance, certain market segments might be more amenable to paying a deposit upfront than others, or certain market segments might pay more for a certain room category.
Of course, this is a surface-level analysis in that while a visual of the DAG can show us where dependencies exist between different variables, they cannot explain the nature of those dependencies or why they exist.
From this standpoint, getting an overview of the relationships between different variables before conducting the further analysis can be quite useful.
Further Analysis
After having generated a plot of the DAG in more detail, we can now analyse the parameters in more detail.
A brief look at another example
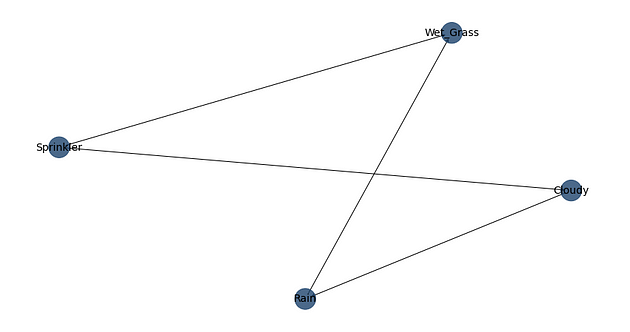
Let’s consider a different example for a moment — the sprinkler example as provided under the bnlearn library.
Source: Jupyter Notebook Output
When analysing the dependencies here, we can see that there exists a relationship between rain and clouds, whether the sprinkler was on or off and the incidence of wet grass.
The CPD (or conditional probability distribution) can be calculated between the variables.
For instance, here is the CPD of the Rain variable that was generated.
If it was cloudy, the probability of not observing rain is at over 65%. The probability of observing rain is at just under 35% under these conditions.
On the other hand, if there were clouds present then the probability of observing rain is at over 66%, with just over a 33% probability of observing no rain.
Back to our hotel example
Now that we have considered a more simplistic example, let’s take a look at some of the CPDs that were generated across the hotel data.
>>> model = bn.parameter_learning.fit(DAG, dfnum)
The probability of seeing a cancellation in its own right is just over 38%.
Now, let’s consider the impact of different variables across cancellation probabilities.
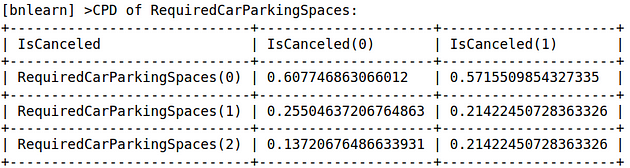
Required Car Parking Spaces
Source: Jupyter Notebook Output
We can see that if there are no required car parking spaces available, then the probability of a customer canceling increases significantly.
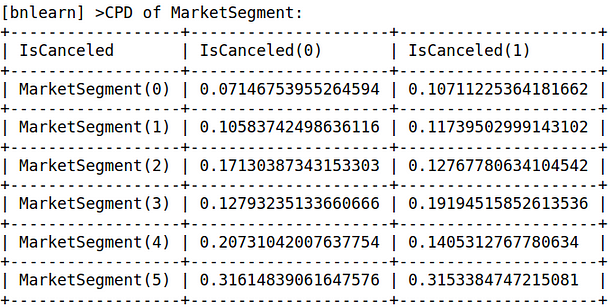
Market Segment
Source: Jupyter Notebook Output
From this CPD, we can also see that certain market segments show a higher cancellation probability than others.
Now, let us suppose that we wish to consider the impact of select combinations of variables on cancellation probabilities.
Let’s take the meal variable as an example. What is the probability of any one customer canceling if the hotel does not cater to a customer’s dietary requirements?
We can see that the probability of cancellation falls to just over 33%. When removing the meal variable, the probability is just over 34%. From this standpoint, the analysis indicates that a hotel that has sufficient parking spaces for customers who demand it would be significantly less likely to cancel.
In this way, the bnlearn library is quite useful in both providing a high-level overview of conditional probabilities that exist between variables, as well as a more detailed analysis of the nature of those dependencies.
Many thanks for your time, and any questions or feedback are greatly appreciated. The article was originally published here. You can find more of my data science content at michael-grogan.com.
The development of machine learning algorithms is making great strides and especially in the field of natural language processing (NLP) and image processing, groundbreaking developments can be observed from one year to the next.
Deep learning approaches, in particular, have led to revolutionary developments, however, the fact that the preparation of vision datasets is very labor- and cost-intensive remains a serious problem. Classical computer vision algorithms recognize patterns of the pixels of an image (these are the features) by analyzing shapes, distances between shapes, colors, contrast ratios, and much more. Millions of images must therefore be laboriously labeled. A photo with a beach and a palm tree needs to be labeled as such to be used as data input.
At the beginning of 2021, Open.ai presented a groundbreaking development with CLIP (Constrative Language – Image Pre-training). CLIP is a neural network trained on 400 million image-text pairs from the Internet. The images used have been trained using natural language supervision, giving CLIP “zero-shot” capabilities like GPT2 or GPT3. This multi-modality training CLIPs performance can be compared with ResNet-50 on ImageNet without the need for 1.28 million labeled data, making CLIP a game-changer for visual classification tasks. In short, CLIP pre-trains an image encoder and a text encoder, resulting in images and texts being represented in the same vector space. The evaluation of CLIP took place as a zero-shot image classifier, but there are numerous other applications of CLIP.
To try out the features and benefits of CLIP, I considered the following scenario in a tourism context. Visual communication is becoming increasingly important in tourism marketing. Instagram and Co have given classic destination marketing a hard time because the relevance of user-generated content is beyond doubt. UGC and the messages of destination management organizations (DMOs) are fighting for attention. In this respect, the analysis of UGC is becoming increasingly important for destinations. On the one hand, to get a feel for the perceived image of tourists and to shape the development of offers accordingly (read our paper about clustering destination image using ML), on the other hand, to post tailored information via social media channels that bring high engagement.
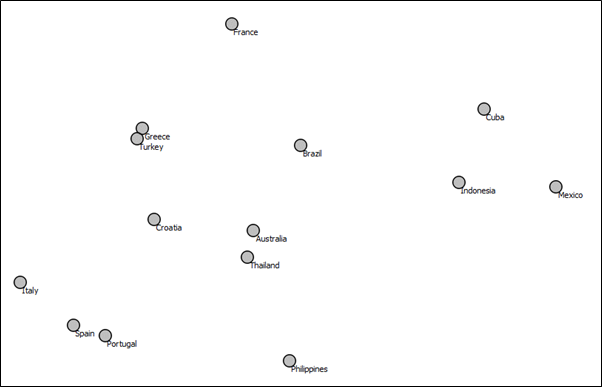
Study & Method Pictures are worth a thousand words, but without context, they can become interchangeable. For my example, I chose images of beaches. To do this, I crawled 600 Instagram posts with the hashtag #wonderfulbeaches. Geoapify was used to extract the geo-location (lat/long) from the location descriptions of the posts. Then I selected 10 photos of beaches (only landscape without people or buildings) for the countries (Australia, Brazil, Croatia, Cuba, France, Greece, Indonesia, Italy, Mexico, Philippines, Portugal, Spain, Thailand, and Turkey). These 140 pictures were downloaded and saved together with texts. For each image, there were three textual descriptions. “This is a beach in [country]. So for example -” This is a beach in Greece” the two other sentences contained also a positive and negative sentiment. “This is a wonderful beach in Greece”, “This is a terrible beach in Greece”. This was done to see the textual impact of country names in the embedding of the images as well as the sentiment impact. Since CLIP uses the same vector space (512 dimensions) for both images and texts, vectors were created for the images alone, for the texts alone, and once the vector sum for image and text. The idea was to extend the image vector by the textual “context vector”.
The vectors were then reduced with t-SNE. Figure 1 shows the two-dimensional text-vector space for the countries used. It is interesting to see how the semantic proximity of two terms partly reflects the geographical proximity. Something like Turkey and Greece or Spain and Portugal. (If you are not aware of embeddings, read here)
Figure 1: Word-Embedding (Countries)
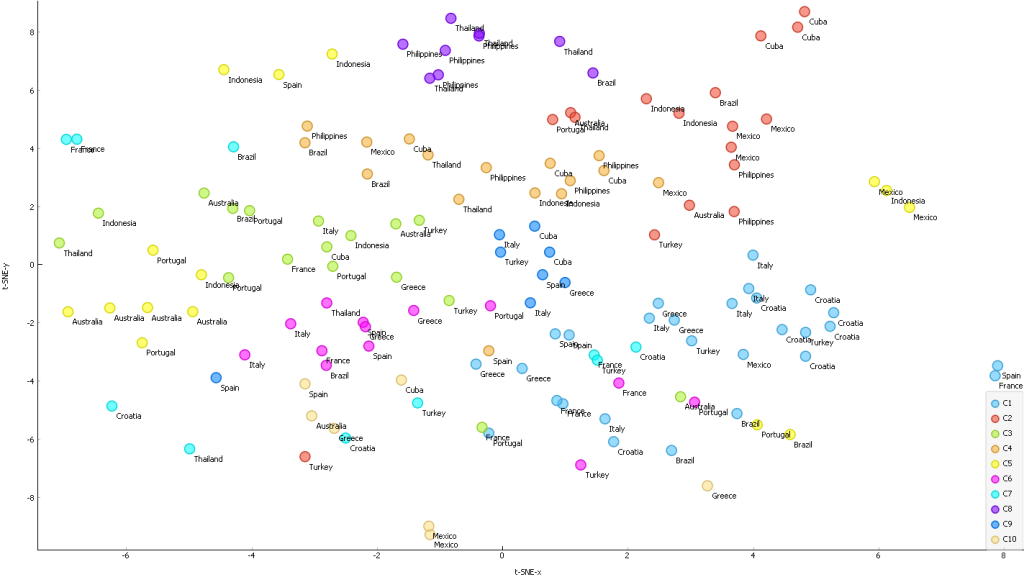
Also, the image embeddings of CLIP already provided interesting insights. Using Louvain clustering (a community detection method, I normalized the data, used 20 PCA components in pre-processing and 15 k-neighbors) similar types of beaches are already grouped together. Figure 2 shows that the clustering of the beaches already corresponds to the geographic spaces. For example, beaches in the Philippines and Thailand (purple on the top) have the same characteristics as beaches in Croatia (light blues on the right) (Figure 3).
However, it became really interesting when I looked at the combined image-text vectors. Figure 4 shows the geographical clustering of the images, Figure 5 the clustering of the image-text vectors on a map. It is clearly visible that the individual beaches can be assigned much better to the actual countries. Of course, the clusters are not that perfect if the regions are very close together (eg. Italy, Croatia)
Figure 4: Only Image-Vectors – resulting in mixed clustersFigure 5: Image-Text vectors – resulting in good clusters
Now I tried to evaluate the results with a classification task. Three models were developed for this purpose. Once a Neural Network, once SVM, and a Random Forest. The model parameters are shown in Table 1.
Model parameters
Neural Network
SVM
Random Forest
Hidden layers: 20 Activation: ReLu Solver: Adam Alpha: 0.0003 Max iterations: 200 Replicable training: True
Number of trees: 200 Maximal number of considered features: unlimited Replicable training: No Maximal tree depth: unlimited Stop splitting nodes with maximum instances: 5
Table 1: Model Parameters
In the following, I tried to classify the images and the images with text information, using the country as a target variable. As expected, the results based purely on the images are relatively poor. The best results are obtained with the Random Forest model.
Model
AUC
CA
F1
Precision
Recall
SVM
0.6847802197802196
0.2714285714285714
0.2766353591198311
0.29982041767756057
0.2714285714285714
Random Forest
0.773186813186813
0.30714285714285716
0.30856541493235523
0.32583289726146863
0.30714285714285716
Neural Network
0.6831868131868132
0.18571428571428572
0.19110876806863095
0.20733353947639663
0.18571428571428572
Model Scores: Images only
In order not to integrate the vector for a country too unambiguously in the combination of image and text, an alternative combination was generated by CLIP in the next step. For this purpose, not the country but the continent in which the country is located was embedded as text information. For a beach in Spain, Portugal, or Italy “Europe” was vectorized as text, for countries like Thailand or Indonesia “Asia”. It turns out that the Random Forest model again performs best, followed by the SVM. I must say, however, that I did not try to tune the models extensively.
Model
AUC
CA
F1
Precision
Recall
SVM
0.8264835164835165
0.4357142857142857
0.4443248535805696
0.46818161996733415
0.4357142857142857
Random Forest
0.911923076923077
0.5285714285714286
0.522848413073977
0.5442473201401773
0.5285714285714286
Neural Network
0.7914285714285715
0.2571428571428571
0.2552245140480435
0.27814762268543786
0.2571428571428571
Model Scores: Images + Text (continents)
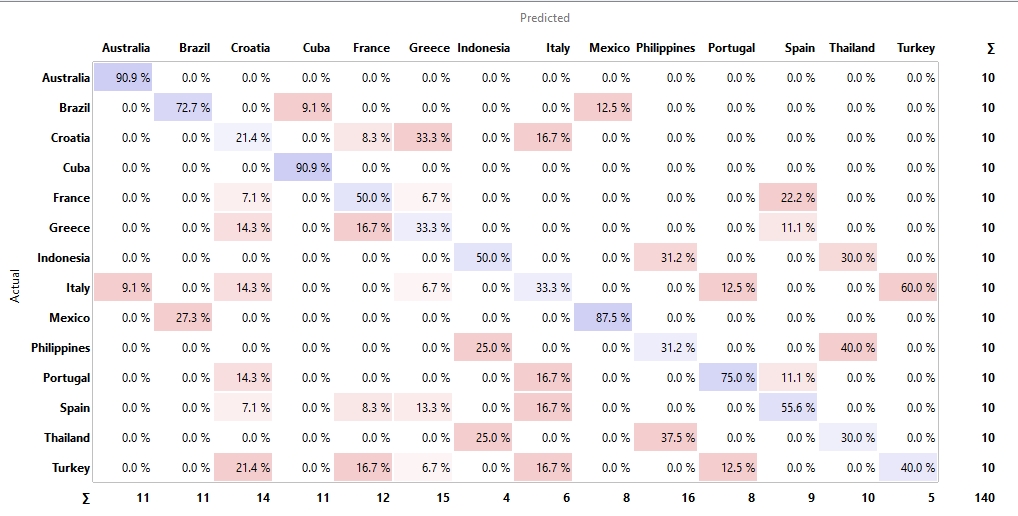
Also from the Confusion Matrix, it can be seen that the correct assignment to the according countries was now already quite ok in some cases.
Figure 6: Confusion Matrix – Continents
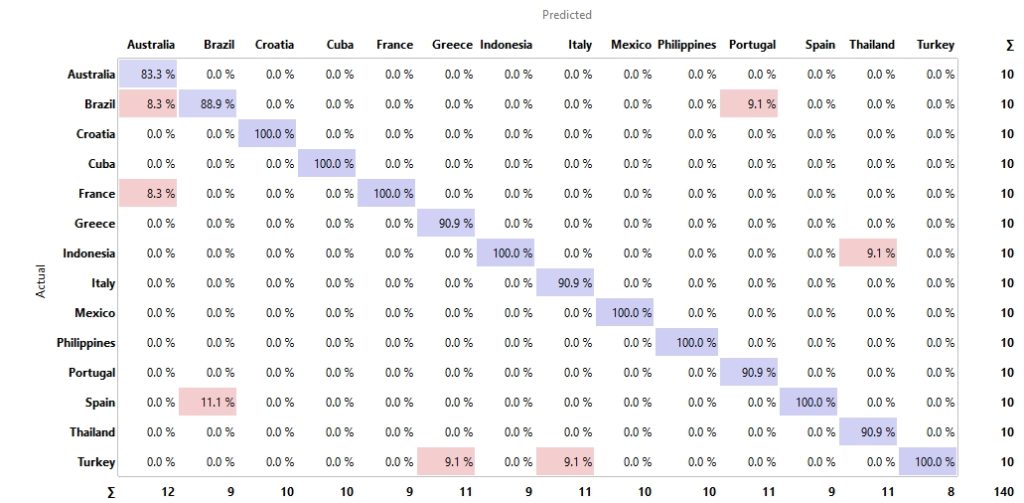
Finally, the image-country vectors were classified and it shows that here almost all images of beaches could be assigned to the correct countries.
Model
AUC
CA
F1
Precision
Recall
SVM
0.9565934065934066
0.8071428571428572
0.8061427389761813
0.8162004662004663
0.8071428571428572
Random Forest
0.9908791208791207
0.95
0.9494081524156712
0.9541847041847044
0.95
Neural Network
0.8942307692307692
0.5214285714285715
0.5222826109155263
0.5519886859172574
0.5214285714285715
Model Scores: Image + Text (countries)
Figure 7: Confusion Matrix – Countries
It was also interesting to see how the positions in the vector space shifted when a positive or negative connotation was included in the sentence (wonderful vs. terrible). The shift is noticeable but not so strong as to displace the dominance of the country’s information. This study thus shows that it is possible to extend image embeddings with text embeddings using CLIP and thus make them more precise. In the future, for example, the images of Instagram posts could be enriched with text information, or photos on review platforms could be combined with text descriptions. Projects like “Concept” from Maarten Grootendorst use CLIP to develop a kind of topic modeling for images. In the future, the combination of images and text could provide a much better insight than classical topic modeling attempts with LDA, NMF, etc. can do today.
Utilizing a scientometric review of global trends and structure from 388 bibliographic records over two decades (1999-2018), this study seeks to advance the building of comprehensive knowledge maps that draw upon global travel demand studies. The study, using the techniques of co-citation analysis, collaboration network, and emerging trends analysis, identified major disciplines that provide knowledge and theories for tourism demand forecasting, many trending research topics, the most critical countries, institutions, publications, and articles, and the most influential researchers.
Especially, the increasing interest and output for big data and machine learning techniques in the field were visualized via comprehensive knowledge maps. On one hand, in big data era, a more reasonable integration of web-based data is the focus and direction of future research in forecasting tourism demand. While surveying contemporary topics and trends to understand tourists’ thinking and motives, several researchers have used search engine data and tourist emotion data as input variables to improve prediction accuracy.
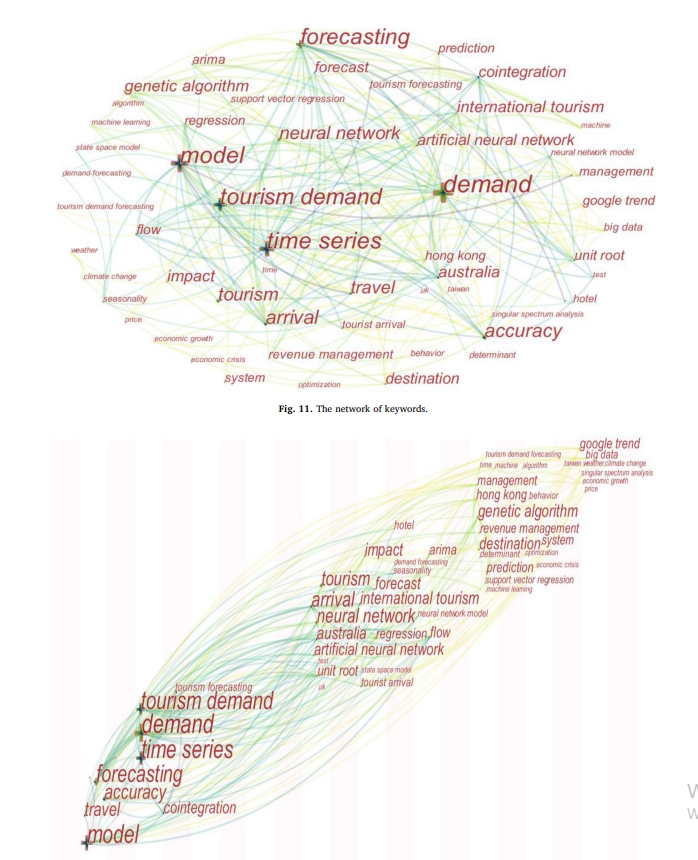
Figure 1: Time zone map of keywords on tourism demand forecasting
The studies revealed how web-based data from search engines, website traffic, and tourist emotion can be shaped into an exogenous variable to better forecast demand. Big data quality management has the potential to improve forecasting accuracy (Dergiades et al., 2018; Bokelmann & Lessmann, 2019), as well. Moreover, the influence of tourism-related events on demand, such as data applications generated by 5G technology, high-speed railway construction, policy measures, and thematic tourism (such as agritourism, parent-child travel) are, so far, untapped research directions. On the other hand, although artificial intelligence methods represented by neural network, genetic algorithms, and support vector regressions have been applied by scholars to tourism demand forecasting, deep learning has been less widely applied than in some other fields. Were deep learning’s application to tourism demand forecasting to reach full swing, there is a greater possibility for improving the prediction accuracy. Furthermore, based on the keyword clusters network, researchers have attempted to combine forecasts generated from different models to try to improve accuracy, but additional advanced individual forecasting methods and multiple forecasting horizons should be explored (Shen, Li & Song, 2011).
This research provides meaningful guidance for researchers, operators, and decision-makers who wish to improve the accuracy of tourism demand forecasting.
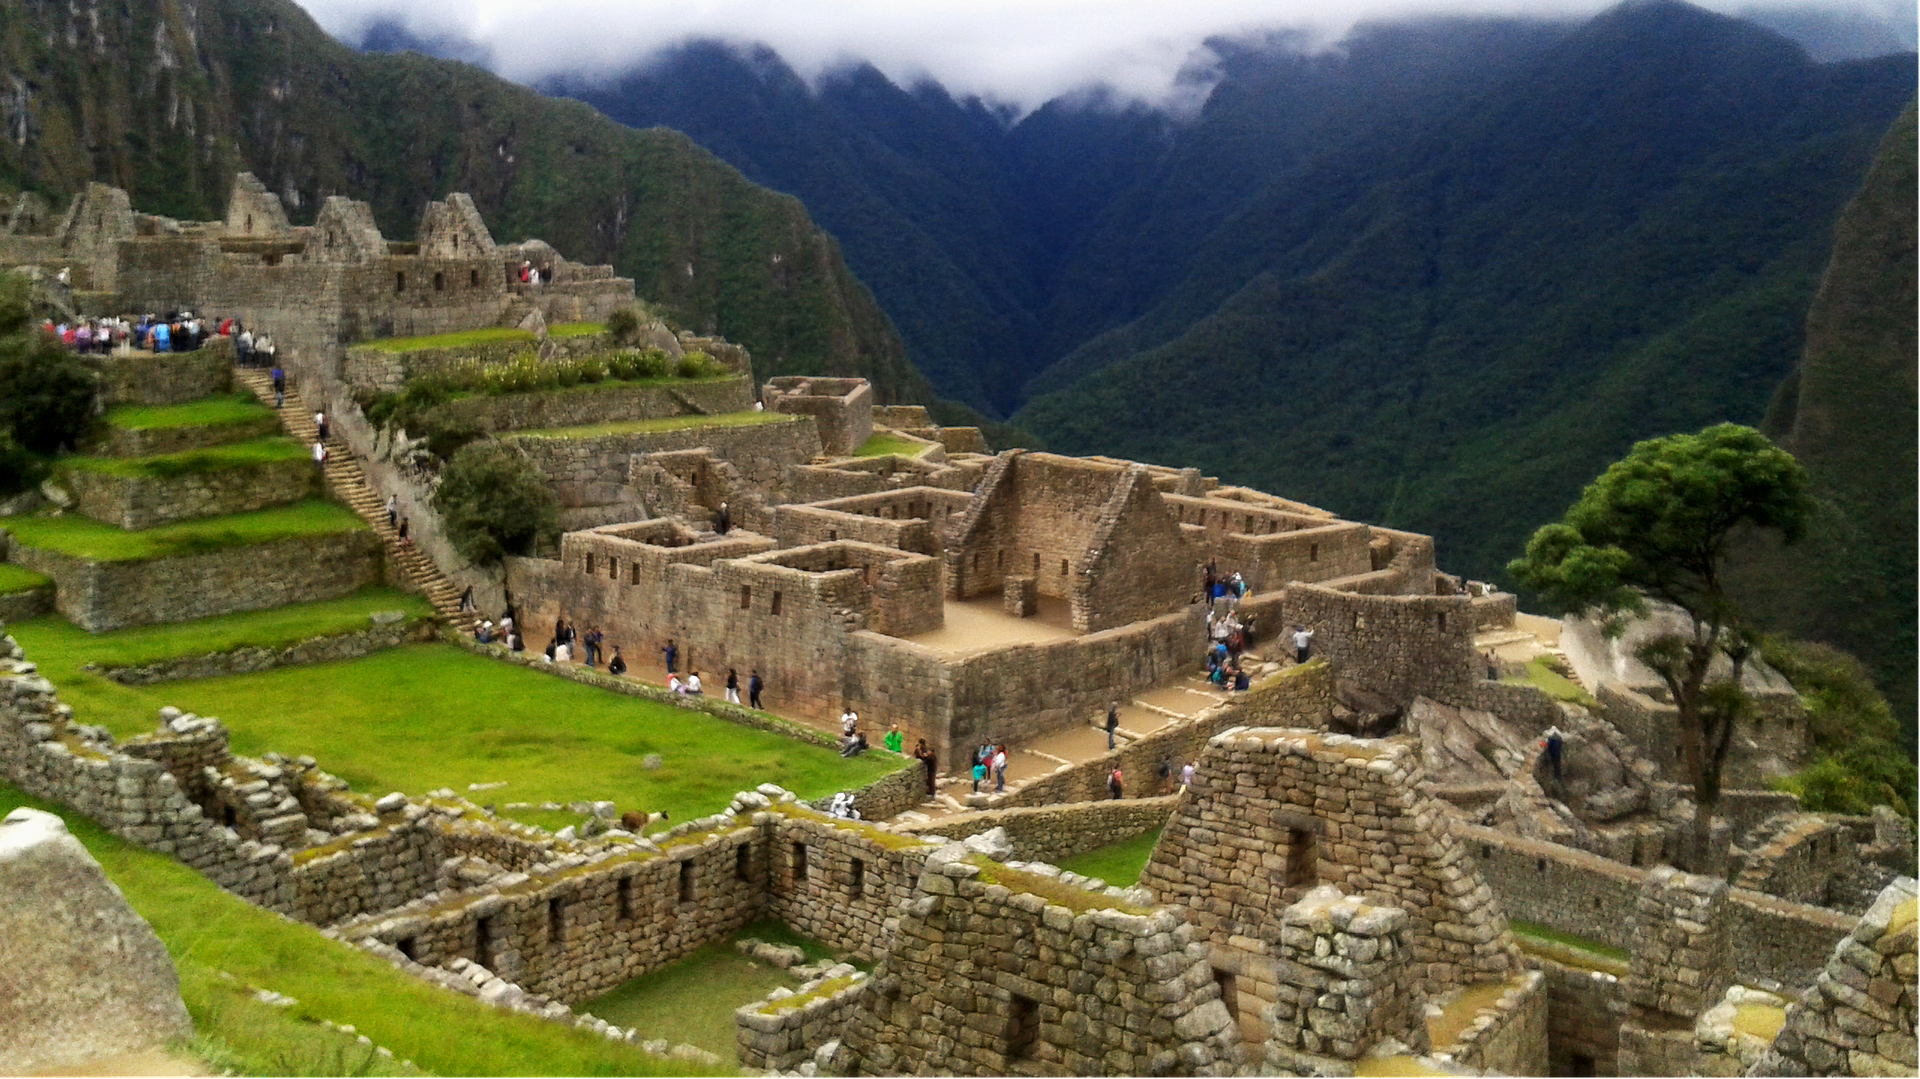
Social media has given rise to an influx of publicly distributed images that can be leveraged by tourism professionals, heritage managers, and digital humanities specialists when paired with computer vision and machine learning algorithms. Using geotagged community internet photographs we identified visitor movement patterns across a known archaeological tourism circuit and quantified visual culture and tourist experiences in Cuzco, Peru. The goals of our research were to understand how social media and heritage guidelines influence travel patterns across Cuzco’s tourist circuit and to assess the aesthetic preferences and visual patterns associated with evolving tourist expectations, many of which are grounded in historic site representations.
Our photo dataset consisted of 57,804 photos from 2,261 users collected across 12 archaeological sites between 2004-2019. Tourist movement across sites was fit to a Markov model, and then applied to determine travel patterns between ten Boleto Turístico del Cuzco (BTC) sites via multi-day-trip itineraries, as well as visitor flows between BTC sites and two UNESCO World Heritage sites. Metadata collected from geotagged photos (e.g., number of users, total photos taken, and average time spent at sites) was used to analyze the popularity of sites and BTC itinerary packages. Then, to automatically evaluate the iconicity of modern tourist photos, we identified major photography themes at each site by clustering and t-SNE-visualizing computed features of photos to obtain the dominant clusters as themes as well as theme transition between sites. Features of photos are computed by a convolutional neural network (CNN) trained to recognize common object categories (animals, plants, etc.) using ImageNet. To further facilitate the interpretability of the identified photo themes, we extract scene labels (mountain, church, etc.) using a CNN architecture trained on the MIT Places dataset. Finally, we considered how historic expedition photographs continue to define Cuzco’s tourist experience and aesthetic representation.
Highlighted results from our work reveal changes in movement patterns between archaeological sites after the newly released BTC package in 2008, increased image cluster diversity at smaller archaeological sites with more homogenous photos at large sites, and an aesthetic correlation between representative images in the top 10% of clusters with historic expedition photographs.
In recent years, numerous studies have been conducted on dark tourism. However, while several issues have been analysed and discussed much remains to be done in the field of motivational factors. The existing literature provides average data about motivational issues using traditional methods of gathering information (interviews, surveys, etc.) and rarely investigates dark tourism through social media. Therefore, this study seeks to understand what motivates people to visit dark tourism sites such as the Chernobyl exclusion zone by applying an automated text analytics approach.
The primary goal of the study was to provide a clear picture of tourists’ perception of the Chernobyl Nuclear Power Plant. Tripadvisor was chosen as a source for data collection as tourists are increasingly sharing their experiences and leaving feedback online. Several natural language processing methods, such as topic modelling (LDA) and sentiment analysis, were applied to extract the primary motivators behind a visit to Chernobyl.
Owning to the unstructured and complex nature of the reviews collected from Tripadvisor, the data was preprocessed. At the initial stage, the text preprocessing pipeline was applied to obtain meaningful data from unstructured text. At the initial stage, a word-cloud was generated to show word frequencies. Based on this, a list of stop words was made and undesired words (e.g. we, me, and), numbers, and brackets were eliminated, lemmatization was conducted. The remaining text was turned to lowercase, all diacritics and accents were transformed to a basic format. Word clouds showing the importance of data preprocessing are presented below:
Figure 1 Word cloud before preprocessing
Figure 2 Word cloud after preprocessing
Figure3 Word cloud after preprocessing
Following next, topic modelling with LDA technique was performed. The main advantage of topic modelling is a derivation of hidden patterns that could not be observed with human interaction (Blei, 2012; Joshi, 2018; Bansal, 2016; Rajasundari et al., 2017). Also, algorithms of topic modelling can be applied to massive collections of files and adapted to many kinds of data (Blei, 2012). LDA analysis suggested 5 potential topics with specific sets of keywords having the highest probability. Topic labelling was grounded on the qualitative analysis of reviews. To assign a theme to each topic, some of the reviews were read manually. Indeed, this approach can be more effective than the results provided by the software.
To interpret topics and to visualize topic models, pyLDAvis, a web-based interactive Python visualisation, was utilised.
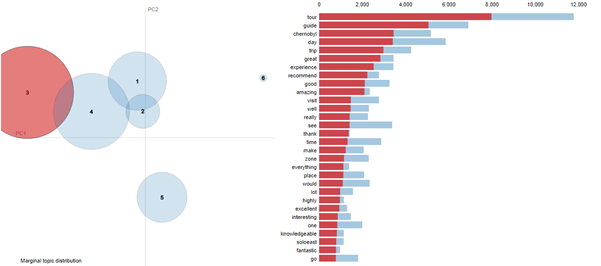
Figure 4 Intertopic distance map (interactive version is available: tinyurl.com/4s4x74mx)
First, pyLDAvis presents a general view of the topic models and shows how they relate to each other. Second, it provides a panel with the most relevant terms for each individual topic allowing for a detailed analysis and interpretation of the topic models (Sievert and Shirley, 2014). A proper topic model will have little or no overlapping (Li, 2020). It can be seen from the map that four generated topic models have little overlapping as they describe emotions and experience. Topic model five has no terms in common with other topic models. The reviews of this topic mainly describe locations (Pripyat, Chernobyl, zone) and technical details (reactor, radiation, power, plant). Also, the visualisation tool provides data about the size of topic models. In other words, it shows how reviews are distributed between topic models or what topic was based on the biggest number of reviews. The biggest topic model is Topic 3, the smallest – Topic 2. It is assumed that reviews belong to a more differentiated tourist type visitors wrote mostly about organizational details of tours and tour structure, less often – about emotional experience.
Topic modelling results present five main topics discussed by tourists. Based on the current study results, the main motivational factors of being interested in Chernobyl and visiting this location are historical experience, emotional experience, sharing experience, and educational experience. It is not surprising that many reviews had nothing in common with motivations but contained information about the organisation, tour structures, and schedule. It shows that the organisational moment and planning are essential for making a decision.
Furthermore, sentiment analysis was conducted to uncover consumers’ positive and negative feelings based on their reviews. Being a field of research in NLP, sentiment analysis extracted and classified opinions and attitudes to the location and detected and analyzed emotions people have had during their trip to Chernobyl. At this stage, VADER, a lexicon- and rule-based algorithm for sentiment analysis, was used. VADER assigns a score to a particular list of words and indicates its compound feeling where +1 is the most positive and -1 is the most negative. The total sentiment score is positive but close to neutral. It explains that people felt both positive and negative emotions while visiting or reflecting on Chernobyl. The negative compound scores show that the Chernobyl accident and the zone are considered dark tourism attractions in common sense. However, Chernobyl is not a synonym for death anymore. After visiting this place, positive emotions can be interpreted as visitors’ desire to learn new things, share knowledge and emotions, and friendly staff.
This study follows an interdisciplinary research approach applying innovative data analytics methods to investigate dark tourism through social media. By implementing NLP methods, this study reveals tourists’ perceptions from online reviews, which are not easy to discover by traditional approaches. Today, travel blogs and review platforms are not the only tools to express an opinion. Therefore, it is necessary to discover the potential of online reviews by adopting new approaches from computational social science. Moreover, the results provide guidelines to tourism managers in monitoring new trends in tourism, understanding tourists’ needs, and wishes, and evaluating the quality of products or services.
Natural Language Processing is developing rapidly and not only the performance of the algorithms is constantly increasing but also their use is becoming much easier. AI communities like Huggingface make a variety of state-of-the-art models accessible and usable with just a few lines of code. For this reason, I took a look at two pipelines and tried them out. On the one hand, I will try to generate a longer text from a short input text, in the second case the opposite should happen and a text should be summarized.
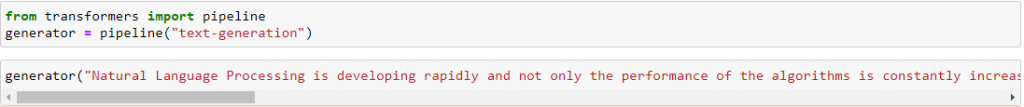
Huggingface offers the pipeline “text-generation” for the generation of text. For tasks like this, huge transformer-based language models are trained on the basis of millions of text data. Huggingface offers access to well-known models such as GPT2 from Open AI or XLNet.
For the task of text generation, I used the first paragraph of this post as input. It only takes three lines of code to try out this task. I used “max_length = 300” to define the maximum length of the generated text.
The first part of the result (here in italics) repeats the input text. Then the model tries to continue with the automatically generated text.
[{'generated_text': "Natural Language Processing is developing rapidly and not only the performance of the algorithms is constantly increasing but also their use is becoming much easier. AI communities like Huggingface make a variety of state of the art models accessible and usable with just a few lines of code. For this reason, I took a look at two pipelines and tried them out. One is to try to generate a new text from a short existing text, in the second case text summarization is to be used.\n\nThe data set was divided into two main tasks. First, it needed to get the language in the system, on a local and remote server. Second, we wanted to get a translation of our text for the system.\n\nTo do it, I ran a bot which is very simple and easy to learn. On a local and remote, the system translates the text from local to remote but in addition, the system needs some resources to communicate with the local server. The language model is a state of the art. It is designed mostly with local language recognition in mind, making it far easier to understand a native language as it changes through the code.\n\nWhen we try to find that there are problems in the code then our interpreter will interpret them in a way that will reduce the speed of our language learning. For a few lines of code, our bot creates a bot.js file in the system, in a specific file, in the server's root project directory. Now, we could try to apply"}]
How far this text makes sense is up to the reader. Of course, the input is largely responsible for the quality of the output.
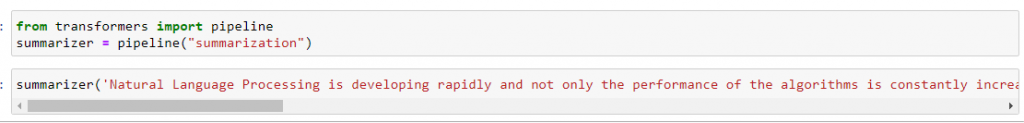
For the summary of a text, the pipeline “summarization” is used.
[{'summary_text': ' AI communities like Huggingface make a variety of state of the art models accessible and usable with just a few lines of code . For this reason, I took a look at two pipelines and tried them out . One is to try to generate a new text from a short existing text, in the second case text summarization is to be used .'}]
Again, I used the first paragraph of this blog post as input, and as you can see this task can be solved quite satisfactorily.